Archive for the 'Uncategorized' Category

Customized Rideshare Incentives

Posted by admin on August 31st, 2010

Recent rideshare surveys have reinforced the importance of economic benefits (cost & travel time savings) in participants’ decisions to share rides (see here). However, there remains much to be learned about the effectiveness of different types of rideshare incentives, and how drivers and passengers respond to different types of incentives.

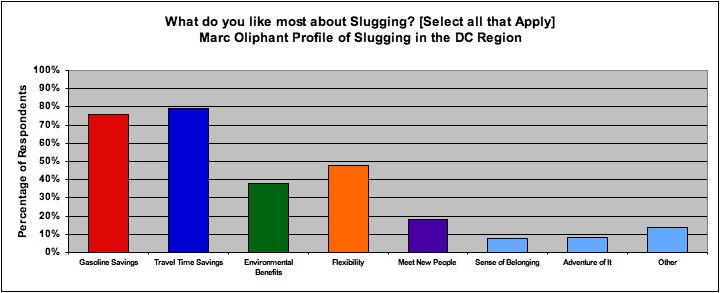
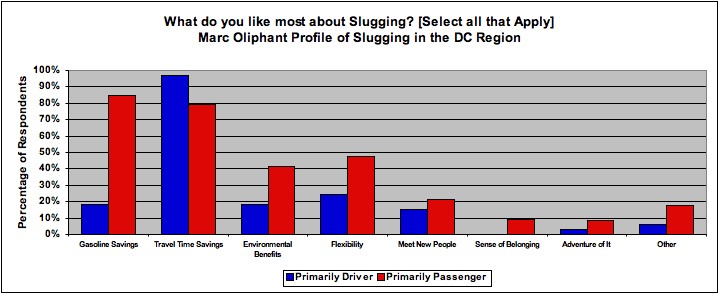
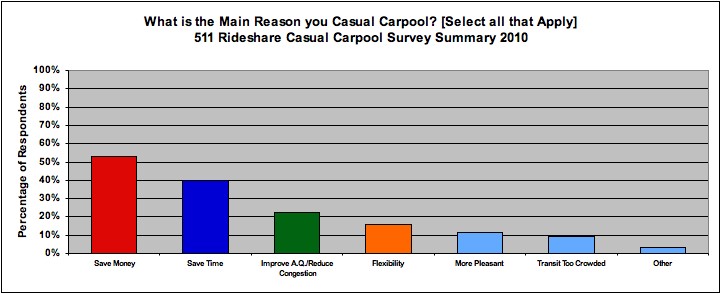
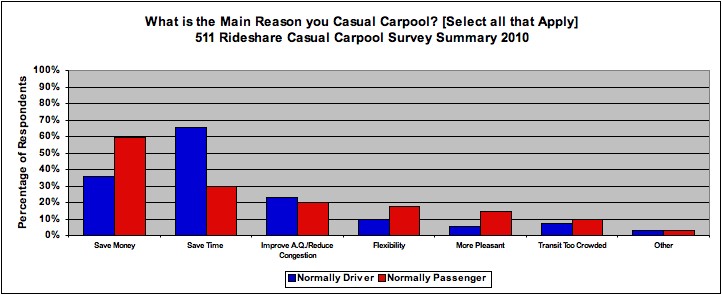
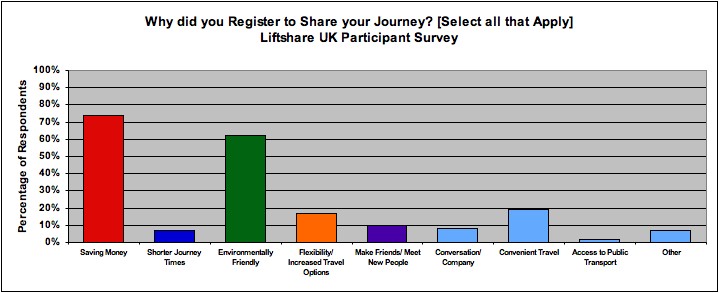
Recent surveys of the slugging population in the Washington DC area and the casual carpool population in the San Francisco Bay area suggest that drivers and passengers choose to share rides for very different reasons. For drivers, the largest benefit from picking up passengers is the travel time savings from the use of the HOV lanes. For passengers, it appears that the motivations to share rides are more diverse, with cost savings and travel time savings remaining the most important factors, but flexibility and environmental benefits ranking strongly as well. This finding is important as groups seek to recruit additional drivers and passengers in rideshare arrangements.


HOT and HOV – The Importance of Personal Choice

Posted by admin on August 31st, 2010

Commuters are a heterogeneous group. When presented with roadway congestion, some portion of the commuting population will be interested in paying a toll to avoid it, some portion will be willing to share a ride to avoid it, and some portion will not be willing to change their behavior and will simply endure the congestion. In other words, commuters are likely to sort themselves into those who are “willing to pay”, those who are “willing to share” & those who are “willing to wait”. Public sector decision makers should be cognizant of these three choices when deciding on the characteristics of future road infrastructure.

While HOT lanes have garnered much interest recently, the importance of non-tolled infrastructure that encourages high occupancy travel should not be ignored. These types of facility provide users with an additional travel behavior choice and may provide important equity benefits for those groups that cannot afford access to tolled infrastructure. Ideally, future infrastructure will encourage higher occupancy travel through both toll and non-toll travel choices.

Comprehensive Participant Engagement

Posted by admin on August 31st, 2010

The ‘rideshare challenge’ is as much about human preferences as it is about the need for improved technology. As such, future initiatives should place as much emphasis on participant engagement efforts, such personal travel planning and the provision of rideshare incentives, as it does on advanced technologies. Preliminary research efforts suggest that the provision of personalized travel information can influence travel behavior and reduce SOV trips by 10% or more. Incentives have long been a successful mechanism to encourage ridesharing and are likely to remain important for the foreseeable future. Personal travel planning and incentives tend to be the most expensive components of a rideshare initiative, however designers should resist the urge to eliminate these features, as they are as likely (if not more likely) to increase the overall level of rideshare participation as technology enhancements alone.

Further “Real-Time” Trials

Posted by admin on August 31st, 2010

While the addition of “real-time” services is assumed to improve trip flexibility and address safety concerns, few comprehensive trials have been undertaken (utilizing advanced, mobile phone technologies) to understand how participants would use this type of service and whether those benefits are desirable enough to encourage greater participation. Given that recent surveys indicate that travel time savings and cost savings are the most important motivators for rideshare participants, the research team believes that multiple “real-time” rideshare trials in a variety of locations, with a variety of incentive packages are necessary to provide more information on the relative value of “real-time” services and their ability to increase participation.

Integrated Travel Information

Posted by admin on August 31st, 2010

The complexity of personal schedules and trips is such that future rideshare participants are unlikely to rely exclusively on a single mode, ridesharing or otherwise. As such, the provision of integrated, real-time, multi-modal information allows participants to make informed travel choices. The integration of transit information with rideshare opportunities would be particularly appropriate, as these two modes tend to complement one another in existing successful rideshare arrangements (such as the ‘casual carpools’ in the San Francisco-area, and the ‘slug-lines’ in the Washington, DC-area).

Focus on Large Employers

Posted by admin on August 31st, 2010

Focusing on large employers offers numerous advantages in rideshare service provision.
First, some studies have demonstrated that the vast majority of shared rides take place between family members, co-workers and neighbors, because of the common social connection, or ‘social network’. The targeting of large employers naturally overcomes some of the safety concerns associated with ridesharing because employees share a common social connection and the threat of employment repercussions (such as a reprimand or termination) discourages undesirable behavior.
Second, the journey-to-work is generally a commuting trip that takes place during peak periods when congestion is high. The targeting of SOV commuting trips offers the greatest congestion reduction potential.
Third, from a matching standpoint, targeting large employers where all drivers and passengers share a common destination (and origin) simplifies the matching process and increases match rates by changing the typical ‘many-to-many’ matching process to a ‘many-to-one’ process.

Final Observations

Posted by admin on August 31st, 2010

The substantial difference in modeled rideshare potential and the observed level of ridesharing suggests that human preferences, or attitudes, appear to be a much larger barrier to increased rideshare participation than incompatible trip characteristics.

The high level of rideshare potential within the MIT community suggests that policy makers may want to target large organizations for increased rideshare participation. Large organizations have some key characteristics that make them amenable to rideshare promotion including a large ‘social network’ of employees that are likely to know one and other (thereby reducing safety concerns), a common destination (making the matching process simpler & increasing match rates), the ability to offer benefits deemed valuable to employees (such as reduced parking costs and flextime), and the legitimacy to gather large amounts of personal travel information from employees.

Large organizations that have detailed travel information also have the ability to engage employees in customized travel planning. Providing highly tailored travel information, such as the variety of travel modes available to a specific employee, and/or the number of fellow employees that they could potentially rideshare with, allows firms to provide an unconventional benefit while simultaneously encouraging changes in travel behavior.

Rideshare Model Shortcomings

Posted by admin on August 31st, 2010

Even though the MIT Commute Survey contains very detailed information on travel habits, many of the drawbacks of this modeling effort actually relate to a lack of detailed information on certain aspects of commute behavior among community members. For example, the model assumed that commuters make direct trips to and from home. In reality, trip chaining is quite prevalent and reduces the number of commuters that can reasonably rideshare. Additionally, intra-week schedule variability is quite common. Commuters may modify their departure times throughout the week based on various home or work commitments. The MIT survey was not sufficiently detailed enough to answer questions about intra-week variability; it only asked for arrival and departures times to/from campus on “a typical day”. Further, this analysis has focused exclusively on a single, large institution. In many ways, MIT’s physical location, community size and transport options are unique. While the results are important for MIT, they may not necessarily transfer to other subsets of the MIT community that did not complete the survey, or to other institutions. In order to gain a better understanding of rideshare potential and relative importance of trip characteristics and human attitudes, similar modeling efforts with organizations of different sizes and in different geographic locations would be desirable.

Modeled Potential vs. Observed Rideshare Behavior

Posted by admin on August 31st, 2010

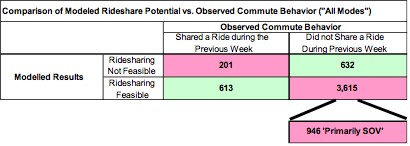
While the aggregate results of rideshare potential at MIT are interesting, the comparison of the modeled results against the observed travel behavior of the MIT community is perhaps more interesting. The matrix shown below compares the modeled and observed travel behavior for the 5,061 commuters considered in the ‘base case’ (five minute deviation) analysis. Along the left side, community members are identified by their modeled rideshare feasibility. Along the top, they are identified by whether they engaged in any form or ridesharing (carpool or vanpool) at least once during the previous workweek. The “All Modes” group of commuters was used rather than the “Primarily SOV” subset because the analysis is attempting to compare modeled rideshare behavior to observed commuter rideshare behavior, regardless of whether or not these commuters are the ones that would be targeted for an MIT community-based rideshare initiative. If the analysis was limited to the “Primarily SOV” subset, it would be attempting to compare modeled and observed rideshare behavior for a subset that was selected specifically because they do not currently rideshare, largely defeating the purpose of the analysis. However, it would be false to state that 3,615 commuters should be targeted in a rideshare initiative. This group includes community members that already use sustainable modes of travel to get to MIT; they walk, cycle or take transit. From a policy standpoint, the 946 frequent SOV drivers should be the primary targets for increased rideshare participation.

At first glance, the 201 community members that shared a ride when the model suggests they should not have (top-left quadrant) is concerning as it suggests deficiencies or missing variables in the model. Two possible explanations for this include (a) filters that were too restrictive, and/or (b) the influence of unobserved human preferences, particularly the incidence of ridesharing with family members not affiliated with MIT. It is possible that the filters applied were too restrictive in identifying those commuters most likely to rideshare. A more likely explanation is that some of the rideshare trips undertaken were with family members where at least one member of the rideshare was not affiliated with MIT, and therefore did not complete the survey. Previous research has found that between 25% and 80% of ridesharing trips are intra-household, or between family members, so it seems possible that at least some of these shared rides are family based. Unfortunately, the MIT Commuter Survey does not ask respondents to indicate with whom they shared a ride.

Rideshare Viability at MIT

Posted by admin on August 31st, 2010

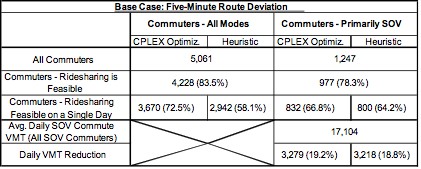
Figure #3 summarizes the results from the analysis of rideshare potential among members of the MIT community. The results for the “All Modes” subset of commuters are on the left side of the figures and the “Primarily SOV” subset on the right side. The number of feasible pairings and the number of pairings possible on a single day are reported, along with the associated percentages of the total commuter population evaluated. For the “Primarily SOV” subset, the daily VMT savings achievable from ridesharing are also provided.

There are a number of important insights that follow from this analysis. To begin, the percentage of the MIT community that can feasibly share rides is very high. Depending on the driver deviation assumptions, between 70% and 88% of the surveyed MIT community has the option of engaging in ridesharing. For those whose primary mode of commuting is SOV travel, approximately 49% to 92% could rideshare if they chose to do so, again depending on the driver deviation assumptions. For the “All Modes” group of commuters, 83% of drivers would have to deviate less than two (2) miles.

On a daily basis, approximately 50% to 77% of the MIT Community could rideshare depending on the model assumptions. This is substantially higher than the current share of the community that chooses to rideshare (8.2%). In terms of VMT reduction potential, the model suggests that 9% to 27% of daily, commuter-based VMT could be reduced through choosing to rideshare, with a ‘base-case’ estimate of a 19% daily reduction in VMT.

Finally, from a methodological standpoint, it is interesting to consider the difference between the CPLEX optimization and simple heuristic approaches to identifying the feasible rideshare pairs on a single day. In terms of the maximization of pairings, one can clearly see that larger datasets favor the optimization approach. For smaller datasets, the difference between the two approaches is less pronounced. For the determination of VMT savings, the two approaches yield remarkably similar results.

A four step analytical approach was undertaken to estimate ridesharing potential at MIT: (1) MIT commuter survey preparation, (2) spatial analysis of commuter trips, (3) application of realistic trip characteristic filters, and (4) selection of feasible pairings.

Several important assumptions have been made during this analysis.
First, this approach assumes that only two-person carpools are possible. This assumption was made to simplify the matching process, however it is not believed to significantly affect the results. The complexity of identifying a third or fourth rideshare participant with a similar schedule and the additional travel time burden of picking up another passenger is likely to limit the number of feasible rideshares with three or more people.
Second, the approach assumes that a driver is willing to deviate from their normal route to MIT to pickup a passenger at their residential location. The prospect of drivers and passengers meeting at a mutually beneficial intermediate destination was not considered. Once again, this assumption was made to simplify the matching process.
Third, it was assumed that when a driver deviates to pickup a passenger, the pickup time is zero. This assumption is certainly unrealistic and understates the commitment the driver is being asked to make. Even in instances where the passenger is prompt there is likely to be some perceived, or psychological, wait time experienced by the driver.
Fourth, the chaining of trips to and from campus were ignored. No information on trip chaining behavior was available in the survey.

Step 1 – MIT Commuter Survey Preparation
MIT undertakes a comprehensive commuter survey every two years to measure commuter preferences and changes in commuting over time. The survey is administered to most of the MIT community and includes responses from undergraduates, graduate students, faculty, academic staff and support staff. The City of Cambridge and the Commonwealth of Massachusetts require that the survey be conducted. For this analysis, the 2008 version of the survey was used.

In 2008, MIT had approximately 21,800 community members including faculty, research staff, support staff, graduate students and undergraduate students. Of the full community, approximately 16,600 on-campus members were invited to complete the survey. Of the 5,200 that were not invited, over half were MIT staff working at the Lincoln Labs facility in Lexington, MA, approximately 15 miles NW of the main Cambridge campus. Approximately 10,300 community members completed the survey, representing a response rate of 62%. Completed survey responses were further filtered to isolate only community members that (a) commute to MIT’s main campus for work, (b) live off-campus, (c) are either faculty or staff (students were eliminated from this analysis), and (d) had a residential address that could be properly geo-coded into a Latitude-Longitude value. Requirements (a) and (b) ensure that a commuting trip is taking place. Graduate and undergraduate students were eliminated from this analysis for several reasons. Undergraduates at MIT are required to live on-campus, or in Institute-sponsored, off-campus housing such as fraternities or sororities. The off-campus, undergraduate housing options are well served by the MIT-operated campus shuttle bus system. It was assumed that undergraduates would rarely, if ever, require a rideshare arrangement to travel to campus. Graduate students were eliminated because of the assumed variability of their daily schedules. The survey does ask for a community member’s arrival time on campus and departure time from campus, but only “on a typical day”. For graduate students, it was believed that responses to that question would be highly variable day to day and would reduce the value of the analysis. Further, graduate students have a much different pattern of residential selection than staff and faculty do. Students tend to live closer to campus, reducing their likelihood of choosing ridesharing as a mode of travel.

Two groups of commuters were identified for use in the feasibility analysis; (1) all commuters regardless of their mode of travel (labeled “All Modes”), and (2) those commuters that traveled to campus as a single occupant driver four or five times during the previous work week (labeled “Primarily SOV”). Note that the “Primarily SOV” group is a subset of the “All Modes” group. While portions of the “All Modes” group already commute using sustainable forms of transportation, they were included in the analysis to see what percentage of the MIT community could successfully be matched and could possibly participate in ridesharing. The “Primarily SOV” subset is the group of greater interest, as they are the ones whose potential travel behavior change would have the greatest impact on reducing VMT and reducing the need for on-campus parking.

Step 2 – Spatial Analysis of Commuter Trips
With 5,061 completed surveys by the targeted groups, including geo-coded residential locations, a spatial analysis of commuting trips to MIT was undertaken. A transportation network model of the greater Boston area developed in a previous academic course was used in conjunction with the TransCAD transportation modeling software package. The road network within the Boston model includes a value for congested travel time on every road link in the network, as calculated by an iterative traffic assignment process undertaken during a previous 4-step transport-modeling endeavor. Whereas the University of Toronto approach looked for clusters of commuters at the residential end using a GIS-buffer approach, this approach capitalizes on the availability of a congested road network that allows for the use of a least-cost travel time algorithm to assign commuters to a path they would most likely choose to get to MIT, if were seeking to minimize their travel time. In clearer terms, while the University of Toronto approach made matches based on residential proximity only, the proposed approach makes matches based on a route that commuters are likely to choose. The added benefit of this approach is that it allows for the matching of drivers and passengers mid-trip, along the driver’s path.

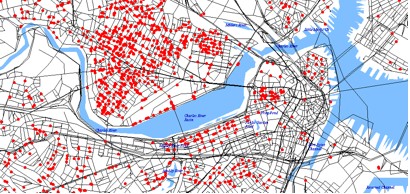
The 5,061 geo-coded commuter records were imported into TransCAD as a series of points. One additional point representing the main entrance to the MIT campus at 77 Massachusetts Avenue was added to the list. The commuter points were linked to the nearest roadway intersection on the network using a spatial join. A road network skim of travel time and travel distance was performed from all commuter points to all other commuter points. Since this procedure was essentially taking the travel time and distance from all 5,062 points to all other 5,062 points, it generated a database table with 25.6M. commuter pairings (5,062 x 5,062), many of which have real potential for ridesharing and some of which are not at all feasible. The third step, applying trip characteristic filters, is where only those rideshare pairings that are feasible are identified.

Step3 – Application of Trip Characteristic Filters
The third step involved filtering the millions of commuter pairings generated in TransCAD down to only those that could be reasonably expected to share rides. With the table of 25.6M. records, one must first determine the direct distance and travel time to MIT for all 5,061 commuters. Since MIT’s location was coded as one of the records, a process of extracting a subset of the existing data table (those pairings where the MIT node was the destination) was used. One can think of these as the SOV distances and travel times for a driver and passenger in a potential rideshare arrangement, if they both chose to drive to campus alone. In the rideshare diagram shown below, these are the segments labeled ‘DirectD’ and ‘DirectP’ for commuters #1 and #2 respectively. The next step involved calculating the carpool distance and travel time. Carpool values were assumed to be the distance/time from the ‘driver’s’ residence to the ‘passenger’s’ residence (the segment labeled ‘Leg1’), plus the distance/time from the ‘passenger’s’ residence to MIT (the segment ‘DirectP’). At this step in the analysis, no restrictions were placed on rideshare roles, so commuters could be identified as drivers or passengers. The difference in values between the ‘driver’s’ direct trip to MIT (‘DirectD’) and the carpool distance/time (‘Leg1’ plus ‘DirectP’) is a particularly important trip characteristic filter that will be described later in this section.

A series of filters were applied to isolate only those commuter pairings that were believed to be feasible for ridesharing. The following list outlines the filters used and the rationale for applying them.

(a) The ‘driver’ is only willing to accept a deviation of five minutes (5 minutes) or less from their normal drive-alone travel time. This was the difference between the ‘DirectD’ segment travel time and the calculated carpool travel time outlined previously. A five-minute threshold was chosen based on previous rideshare survey findings. Li et al. (2007) found that 75% of 2-person carpools in Texas involved a deviation of five minutes or less. Attanucci (1974) previously found that 51% of members of the MIT community were willing to deviate no more than five minutes and an additional 29% were willing to deviate between five and ten minutes. Note that this filter does not restrict the direction of travel. If a passenger is two minutes in the opposite direction from the driver’s residence (and thereby adds a total of four minutes to the driver’s journey), the filter suggests that that trip is as likely to occur as one that requires a four minute deviation off of the driver’s main route to MIT. While this is assumed not to be a substantial burden on drivers it could very well be. As such, sensitivity analyses were also performed at 2 minute and 10 minute deviation thresholds.

(b) The ‘driver’ is unwilling to spend more than 150% of his/her drive-alone travel time to rideshare to campus. This filter only affects those that are already relatively close to MIT. For example, if a driver normally has an eight-minute commute to campus, this filter will limit the feasible set of passengers to those that add four minutes or less to the driver’s journey. For commutes longer than 10 minutes, the “five-minute deviation threshold” filter described above supersedes this filter. As such, this filter eliminates relatively few pairings, but pairings that are quite unlikely to represent desirable rideshare arrangements.

(c) ‘Passengers’ within 1 mile of campus are excluded from consideration. Within a distance of 1 mile, the attractiveness of walking, cycling and transit should be much higher than the attractiveness of ridesharing.
(d) The ‘driver’ in the rideshare arrangement must have access to a vehicle. The 2008 MIT Commuter survey asks respondents whether they have access to a private vehicle for daily commuting.

(e) The ‘driver’ and ‘passenger’ in a rideshare arrangement must arrive on campus and depart from campus within the same 30-minute period. The 2008 survey asks participants to provide their arrival/departure time to/from campus on “a typical day”. Respondents are provided with 30-minute blocks of time (7:00-7:29am, 5:30-5:59pm, etc.) and are asked to choose only one block. The implication of having both arrival and departure times matching for both the ‘driver’ and ‘passenger’ is that roundtrip, rideshare opportunities are assumed.

Step 4 – Selection of Feasible Pairings
At this point, those commuter pairings that are believed to be feasible have been identified. However, there are often cases where a driver has the option of picking up multiple passengers, or passengers can be matched up with multiple drivers. Adding to the complexity, there is nothing stopping a commuter from being a driver in one pairing and a passenger in another pairing. Since the assumption is that only two people can share a ride at any given time, this step requires the specification of a decision variable to select ‘feasible’ pairings, such that no commuter (driver or passenger) is paired up more than once on any given day. In more general terms, one can think of the output of Step 3 as the full list of feasible pairings that are possible over the course of a week or month, whereas the purpose of Step 4 is to select only those pairings that are possible on any single day. This final step is essentially seeking to maximize the number of members of the MIT community that can be paired together by employing an optimization process.

Two approaches were used to identify ‘feasible’ pairings; one approach used the CPLEX algorithm in the OPL Studio software suite, and the second option involved a simple heuristic approach using a standard spreadsheet program. The CPLEX approach involved solving a general network flow problem with side constraints to ensure that a commuter was not paired up as both a driver and a passenger in separate pairings. For the “All Modes” subset of commuters, the objective function used was the maximization of commuter pairs. For the “Primarily SOV” subset, the objective function used was the maximization of VMT savings.

The heuristic approach began by sorting the list of pairings from highest to lowest potential VMT savings, and then employed an iterative approach of selecting drivers and passengers. The first driver-passenger pair with the largest VMT savings was “activated”, and both commuters were removed from consideration in all further pairings. Moving onto the next pairing, both the driver and passenger were checked to see if they were “available” for matching. If either the driver or passenger were previously “activated”, the selected pairing was discarded and the next pair was considered. This process was repeated for all pairings in the list. The decision variable for both subsets of commuters (“All Modes” and “Primarily SOV”) is the maximization of commuter pairs, but implicitly VMT savings are also considered given the initial sorting that took place.

The two approaches have different strengths and weaknesses. The CPLEX optimization approach provides an outcome that is more robust, but requires writing the problem statement in the proprietary language of the software, which is relatively time consuming. The heuristic approach is quite simple to implement in commonly available spreadsheet programs, is not particularly time consuming, but provides a sub-optimal set of feasible pairings. Whereas the heuristic approach may select a single driver-passenger pair that has relatively high VMT savings, the CPLEX approach may identify two pairings, each with relatively smaller VMT savings, but where the total savings from both pairings are larger than the single, high VMT pairing. For this analysis, both the CPLEX and heuristic results will be reported.

Overview of MIT

Posted by admin on August 31st, 2010

MIT’s main campus is located in Cambridge, MA directly across the Charles River from Boston, MA. The Institute is home to approximately 22,000 faculty, staff and students, of which approximately 18,000 are employed or study on the main campus in Cambridge (~8,000 faculty and staff, ~10,000 students). MIT is well served by transit with access to the Massachusetts Bay Transportation Authority’s (MBTA) Red Line at Kendall Square, two limited-stop bus services (the CT1 on Massachusetts Ave. & the CT2 on Vassar St.), and five regularly scheduled bus services (the #1, #64, #68, #70 & #85). Access to the MBTA commuter rail system is possible via the Red Line at South Station and at Porter Square Station, and via the MIT-supported E-Z Ride bus shuttle with service to North Station. MIT owns approximately 4,000 parking spaces and leases an additional 500 spaces.

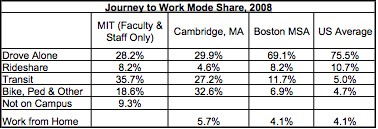
The high level of transit service and MIT’s location in relatively dense Cambridge, MA are two reasons that the use of transit and non-motorized transport are higher than in other parts of the Boston metropolitan area and much higher than the US average. The table below summarizes mode choice for staff and faculty at MIT, in Cambridge, MA, in the Boston Metropolitan Statistical Area (MSA) and across the US.

The impetuses for further exploration of rideshare opportunities at MIT are numerous. First, parking on campus is becoming an expensive challenge for the Institute. The 500 leased parking spaces costs the Institute approximately $1.5M. a year in fees and in recent years, the Institute has begun constructing underground, structured parking at an estimated cost of $125,000 per space (Block-Schachter, 2009). Rideshare promotional efforts may be able to reduce the need for expensive parking construction and leasing. Second, the State of Massachusetts has begun a long-term project to rehabilitate a number of the bridges between Boston and Cambridge across the Charles River. Two of the bridges slated for closure and reconstruction, the Longfellow Bridge and the BU Bridge, are both in close proximity to MIT and will limit vehicle access to campus during the reconstruction phase. Ridesharing could be one important mitigation measure to ensure that an acceptable level of mobility is maintained in the southern part of Cambridge during the reconstruction process. Third, the Institute has made a commitment through the MIT Energy Initiative to ‘Walk the Talk’ and identify areas where energy consumption on campus can be reduced. Vehicle travel to and from campus is not an inconsequential portion of MIT’s energy footprint; two separate student theses have estimated contributions of 4 to 14% of Institute-wide energy consumption coming from private vehicle travel (Block-Schachter, 2009)(Groode, 2004). Ridesharing has the ability to provide additional transport options to the MIT community while helping the Institute ‘Walk the Talk’ on energy efficiency.

Previous Rideshare Viability Estimates in the Literature

Posted by admin on August 31st, 2010

There is relatively little in the recent literature that has attempted to quantify the benefits of ridesharing, and even fewer resources that have proposed a comprehensive methodology of doing so. Given the rather substantial amount of personal information required to determine rideshare viability, it is conceivable that institutions or organizations have conducted these types of analyses but have kept the results private.

Research and consulting reports have been one source for quantified rideshare potential. One early attempt was a 1994 report summarizing the effectiveness of transportation control measures (TCMs) from various state-level trip reduction programs (Apogee Research, 1994). The report found that the provision of rideshare benefits at a regional level could eliminate up to 2% of VMT and 1% of trips. More recently, a report titled Moving Cooler estimated the GHG reduction potential from a wide range of transportation strategies, implemented individually and as bundles (Cambridge Systematics, 2009). For the strategy labeled “Employer-Based Commute Strategies” (of which ridesharing is a component), a logit mode choice model (named COMMUTER) was used to estimate mode shifts and the resulting change in emissions. The COMMUTER model uses aggregate mode choice data for different ‘classes’ of metropolitan area. Emission reductions from baseline were estimated at 0.4 – 2.0% depending on the level of effort employed. The Growing Cooler results require some cautious interpretation; as one might expect, ‘employer-based commute strategies’ includes far more than ridesharing. In fact, this strategy includes provisions for ridesharing, a transit subsidy, modifications in parking policies, a compressed workweek provision and telecommuting. If ridesharing alone is isolated from this bundle, emission reductions from baseline are towards the lower end of the scale (approximately 0.4%).

Academia has also attempted to measure the potential market for ridesharing. A study by Tsao & Lin (1999) is one of the more comprehensive attempts to measure the potential of ridesharing based on spatial and temporal factors. Unfortunately, the study made several simplifying assumptions that greatly underestimate the potential of ridesharing, and likely led the authors to conclude that the benefits were too small to quantify. The study presented a hypothetical metropolitan area with a uniform density of jobs and workers across the entire area. This assumption, while simplifying the author’s model specification, conflicts substantially with observed metropolitan spatial distribution of jobs and housing. In reality, metropolitan areas have substantially varied commercial and residential densities. Higher densities of either commercial or residential activity, and more specifically, the variability of high densities across a geographic area is a major determinant of commuting patterns and increases the likelihood of finding a rideshare match. The authors also assumed that participants would only consider sharing a ride if they lived in the same two-mile by two-mile square area. While some recent research (Buliung, 2010) suggests that rideshare matching at the residential end of a trip is a strong determinant of rideshare potential, Tsao and Lin’s assumption effectively eliminates the ability to match riders and passengers based on the route they travel, thereby underestimating the number of potential riders. While the methodology was meant to look at rideshare potential in a hypothetical metropolitan area, it is important to note that both of the author’s simplifying assumptions lead to an underestimation of rideshare potential.

An analysis conducted by students at the University of Toronto (Sarraino et al., 2008) attempted to measure the number of staff, faculty and students that could rideshare to the St. George campus (downtown Toronto), based on data provided by the university administration. The study used a GIS approach to identify common clusters of commuters that were traveling to campus. It was assumed that shared rides would only occur between drivers and passengers living within a 3 km radius of one and other. This residential proximity assumption is similar to the one used by Tsao and Lin, and could limit some mid-trip pairings. Commuters were only considered as matches if they were leaving their residence within the same 30-minute period. Unfortunately, due to data limitations, only AM residential departure times were available, making any assessment of return trip (or roundtrip) rideshare viability impossible. The analysis found that during morning commute hours (7:00 – 10:30am), 1,461 of 3,030 drive trips (48%) were suitable for ridesharing based on residential proximity and similar residential departure times. Had roundtrip matching been possible, the expected match rate would be lower.

The “Real-Time” Value Proposition

Posted by admin on August 30th, 2010

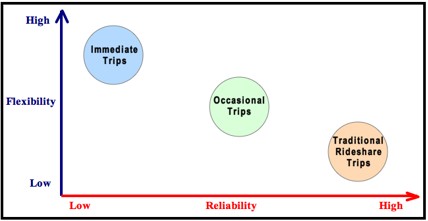
“Real-Time” services effectively expand the number of vehicle trip types that are suitable for ridesharing, thereby allowing greater travel flexibility. It allows drivers and passengers to choose the degree of flexibility and trip reliability based on their needs. Instantaneous trips provide high flexibility, but lower reliability. Traditional, pre-planned rideshare arrangements are quite reliable, but less flexible. Occasional trips provide some combination of the two.

However, it is important to note that in existing, successful rideshare schemes, flexibility is often ranked as less important than economic benefits such as transportation cost savings (gasoline, parking) and travel time savings. In recent surveys of successful, self-organized rideshare services in Washington DC and San Francisco, flexibility ranks 3rd and 4th, respectively, in terms of importance to participants. In a 2008 survey of pre-arranged shared rides in the UK, flexibility remained the third most important consideration behind cost savings and environmental benefits. With this in mind, one must ask whether “real-time” service innovations alone are sufficient to increase participation? The research team’s belief is that improvements in rideshare services, namely “real-time” innovations, need to be paired with financial and/or convenience incentives in order to successfully attract new participants. “Real-time” rideshare trials in a variety of locations, with a variety of incentive packages will begin to provide more information on the relative value of “real-time” services.


Drawbacks of “Real-Time” Services

Posted by admin on August 30th, 2010

The drawbacks of “real-time” ridesharing are a series of trade-offs. While “real-time” innovations can offer greater flexibility and can provide valuable travel data, those benefits need to be balanced against reductions in travel reliability and a loss of privacy.

Flexibility vs. Reliability Trade-Off
A large trade-off involved in the use of “real-time” ridesharing is the loss of trip reliability in exchange for trip flexibility. However, the degree to which these two features are traded-off depends on the type of rideshare trip being sought. While traditional rideshare opportunities suffer from a lack of flexibility, they are quite reliable. On the opposite end of the spectrum, immediate rideshare trips are very flexible, but provide little service reliability. Occasional trips, where matching takes place sufficiently far in advance of the start of the trip to allow for alternate travel arrangements to be made, tends to offer a balance between flexibility and reliability.

Valuable Travel Data vs. Loss of Privacy
“Real-time” rideshare services operating on smart phones with integrated GPS have the ability to generate much more valuable data than simple rideshare trip confirmation. If data were to be collected throughout the day, detailed travel patterns including the prevalence of trip chaining could be determined. From an urban planning and transport modeling perspective, this information could be used to supplement periodic travel diaries and improve the input data used in urban modeling endeavors. With a sufficiently large number of these devices collecting data, traffic patterns and congestion information could be inferred. This information could be quite valuable to public agencies or rideshare providers themselves, however all of these examples of data collection involve a loss of personal privacy for the user of the smart phone. A fundamental challenge with future use of “real-time” rideshare services will be balancing the use of technology for innovative data gathering, while ensuring that personal privacy is respected.

Opportunities Created by “Real-Time” Services

Posted by admin on August 30th, 2010

The benefits of “real-time” ridesharing are numerous, and begin to address a number of the challenges that hinder greater rideshare participation. The most substantial benefit is an expansion in the types of vehicle trip that are suitable for ridesharing. This added trip flexibility is a distinct advantage for “real-time” rideshare participants.

Expansion of Trip Types Suitable for Ridesharing
Traditional rideshare arrangements often involve recurring trips that are relatively fixed in terms of schedule, take place for months at a time and are generally agreed to a day or two ahead of time. In contrast, “real-time” services are often marketed as allowing users to find ‘immediate’ single trips on very short notice, perhaps as little as 30 minutes ahead of time. This raises an important question about the desirability of these ‘immediate’ trips. Is this type of rideshare offering perceived as valuable to potential participants? A study found that of sixty focus group participants, less than a handful were interested in arranging ‘immediate’ rides (Deakin, Frick, Shively, 2010). They felt that these “instant” trips would be difficult to arrange or simply would not work. Rather, participants were interested in arranging rides on a part time or occasional basis with notification of potential trips well in advance, such as the evening before their commute to work. Deakin, Frick & Shively used the term “reliable flexibility” to describe this participant need. However, a recent survey conducted in the San Francisco Bay Area suggests that rideshare participants are a heterogeneous group (Heinrich, 2010). When asked how far ahead of time participants would like to organize a shared ride, 43% desired organizing their ride 15-60 minutes before departure, or on very short notice. The second most popular response was to organize a trip the evening before it was expected to take place (20% of respondents), supporting to a certain degree the preferences uncovered by Deakin, Frick & Shively.
Based on these important insights, “real-time” ridesharing services could cater to three unique types of rideshare trip; immediate trips, occasional trips with advanced confirmation, and traditional, long-term rideshare trips.

Immediate trips, where a passenger seeks a ride on very short notice, might be undertaken when they have found themselves with few transport alternatives. Perhaps the passenger has missed a transit trip or their original rideshare opportunity fell through at the last minute. In this case, trip flexibility is very high, but the reliability of successfully organizing this type of trip is fairly low.

Occasional rideshare trips are likely to occur among commuters that would like to share rides, but have social schedules that change week to week, or work inconsistent hours. In these situations, participants would prefer to establish rideshare arrangements on a day-by-day, or ride-by-ride basis. Ideally, a “real-time” service would send a note to all participants that have identified themselves as looking for occasional rideshare trips at an established point, say 5pm weekday evenings. Participants would have several hours to confirm their desire to share a ride and their desired travel time. At a certain point, say 7pm, no further ride requests would be accepted for the following morning and matching would take place immediately. Several minutes after 7pm, participants that could not be matched would be notified and alternate travel options would be outlined. For those participants that could be matched, the trip details of the appropriate travel partner would be sent and both participants would have a short period of time to review the trip and confirm their intention to ride with that individual. A similar process would take place around midday for the evening commuting trip. These occasional arrangements provide participants with greater schedule flexibility than traditional ridesharing while providing greater reliability than immediate rideshare opportunities.

Traditional rideshare arrangements, whereby drivers and passengers with similar and rather fixed schedules agree to share rides for a longer period of time, can also be provided by “real-time” rideshare services. In these instances, the importance of the personal characteristics of the driver and passenger are more important than the speed of matching. The reliability of the trip is generally high, but trip flexibility is low.

Decreases Transaction Costs
Rideshare services, specifically those with smart phone functionality that actively contact participants with potential matches, can significantly reduce the amount of time needed to establish a rideshare arrangement. The automatic accessing of profile information remotely, including a participant’s current location, minimizes the amount of direct user input needed. Decreasing these “transaction costs” (time needed to establish a rideshare trip) sometimes comes at the expense of a rigorous review of the profiles of potential rideshare partners. Some providers have attempted to overcome this perceived drawback by providing participant ratings that allow users to quickly determine how previous partners have perceived riding with a given person.

Improves Information Availability for Traveler Decision Making
Some “real-time” rideshare services integrate information from other modes of transportation in addition to rideshare options. In the event that a rideshare match cannot be established, transit or shuttle bus information can be provided to users allowing them to make more informed travel decisions.

Reduces “Stranger Danger” Concerns
While some features of “real-time” rideshare services may actually increase “stranger danger” concerns (such as the automatic matching of drivers and passengers), many services have incorporated features that reduce “stranger danger”. Many services work on mobile devices with GPS that theoretically should be able to track each participant’s position throughout a rideshare trip. If a participant agreed to share this type of information with a rideshare provider, it could be used to track participants and ensure that the agreed upon journey is taking place, and it could be used to validate that a successful shared ride was undertaken for those journeys where a financial transaction was agreed to, or where incentives are being disbursed. If this feature is coupled with ‘social network’ features (such as only allowing shared rides between employees within the same firm), ‘stranger danger’ concerns can be further mitigated.

“Real-time” ridesharing has been defined in a variety of ways. One of the first formal definitions proposed for “real-time” ridesharing was developed in preparation for a trial in Sacramento, CA in 1994 (Kowshik et al., 1996). The team behind that trial defined “real-time” ridesharing as “a one-time rideshare match obtained for a one-way trip either the same day or the evening before” (Kowshik et al., 1996). Several years later, researchers developing a similar trial in Seattle proposed that “dynamic ridesharing” be defined as “two or more people sharing a single trip, without regard to previous arrangements or history among the individuals involved…a dynamic ridesharing system must be able to match random trip requests at any time” (Dailey et al., 1997). A more recent definition proposed by ‘dynamicridesharing.org’ suggests that “dynamic ridesharing” is “a system that facilitates the ability of drivers and passengers to make one-time ride matches close to their departure time, with sufficient convenience and flexibility to be used on a daily basis” (Kirshner, 2009). Note that all three of the definitions emphasize the occasional nature of these arrangements, using the term “one-time” trips. The other main characteristic of all three of these definitions is the amount of advanced notice required for the arrangement of trips with the Sacramento definition recommending the “same day or the evening before” a trip, the Seattle definition recommending “at any time”, and the ‘dynamicridesharing.org’ definition recommending “close to [participants] departure time”. In general, “real-time” ridesharing implies that little advanced notice is needed when attempting to establish a shared trip.

For the purposes of the study presented in this paper, “real-time” ridesharing is defined as:
“A single, or recurring rideshare trip with no fixed schedule, organized on a one-time basis, with matching of participants occurring as little as a few minutes before departure or as far in advance as the evening before a trip is scheduled to take place”.

“Real-time” services tend to rely on a similar set of technologies and share similar features. The underlying technological requirements often include:

(1) Smart Phones – Many service designs rely on the recent proliferation of smart phones in the market place. The firms developing the underlying software for “real-time” ridesharing have focused their efforts on platforms with easy-to-use, attractive user interfaces such as Apple’s iPhone software and Google’s Android platform.

(2) Constant Network Connectivity – The need to communicate ride requests and accept offers on short notice requires that one be constantly connected to the network. Many smart phones are now offering (or require) unlimited data plans with new smart phone contracts, facilitating constant network connectivity.

(3) GPS Functionality – The use of Global Positioning System (GPS) functionality has been incorporated into many applications so that they become “location aware”. In other words, participants seeking a ride do not need to key in their current location because the GPS built into their smart phone knows where they are located and communicates this information automatically when trips are logged. This is often marketed as a time saving feature.

(4) Ride Matching Algorithm – All of the underlying systems use some form of algorithm to match riders and passengers. Some of the algorithms do so based only on origin and destination, while some of the newer algorithms match drivers and passengers based on the commonality of their travel route.

(5) Data Repository – All “real-time” systems (and Internet-connected rideshare systems in general) have a data repository where rideshare information is stored. The types of data stored might include a current list of ride requests and offers, individual participant profiles and summary statistics on participation.

Many (but not all) “real-time” rideshare services incorporate additional features such as:

(6) Stored User Profiles – Providers will allow users to create and save information profiles. Personal information such as name, employer, home and work locations, popular origin-destination (OD) pairs with the user’s preferred route, and a photo are common. Some systems require a photo of the driver’s vehicle and license number be provided. Stored profiles require more participant time on the front end, but make future ride requests much less time consuming.

(7) Social Network Integration – Because of the propensity of individuals to share rides with people they know or share common characteristics with, some providers have linked their services to existing social networks in an effort to improve successful matches. For some, this has meant incorporating their services with online networks such as ‘Facebook’. In these cases, only friends within a given individual’s immediate Facebook network will be considered when searching for ride matches. For other providers, ‘social network integration’ has focused on offering services to a specific organization or institution. In these cases, only co-workers at the same organization are considered as potential partners.

(8) Participant Evaluation – “Real-time” services may allow participants to rate each other, much like the online auction service ‘eBay’. After a ride has been completed successfully, both the passenger and driver are asked to rate each other. The idea behind this feature is that it allows future users to evaluate potential partners quickly, based on others past experiences. The theory is that those with higher ratings are likely to be preferable shared ride partners.

(9) Automated Financial Transactions – “Real-time” services may allow for financial transactions between participants. Some allow participants to name their own price, while others recommend a value based on standard Internal Revenue Service (IRS) vehicle cost estimates. Some providers facilitate automatic transactions through the use of online payment systems such as PayPal. Other providers simply calculate the recommended shared cost and allow drivers and passengers to negotiate and agree on a final amount and payment method.

(10) Incentives and Loyalty Rewards Linked to Participation – “Real-time” providers may offer incentives or loyalty rewards based on a given individual’s level of participation, much like airline loyalty programs. Those that participate more frequently earn more points or rewards. Providers hope that by providing incentives, existing participants will be encouraged to post rides more frequently, and new participants will be encouraged to join their service.

Price of Gasoline & Disposable Personal Income

Posted by admin on August 27th, 2010

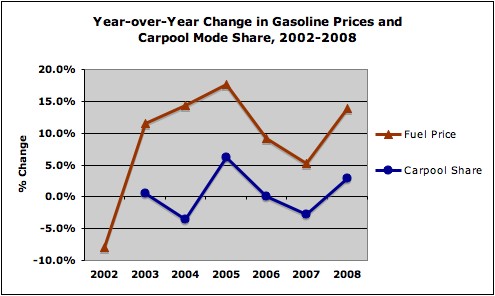
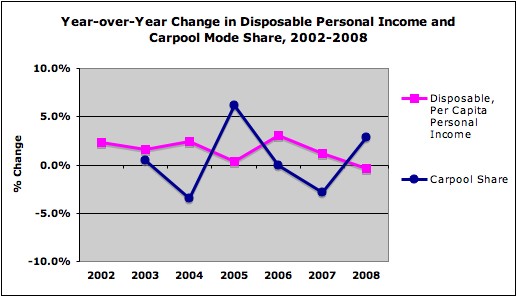
The relationship between high gasoline prices, disposable personal income and changes in aggregate, nationwide rideshare participation from 2002 through 2008 is interesting. As expected, changes in the cost of gasoline and rideshare participation tend to move in the same direction. The relationship between gasoline prices and rideshare participation has a Pearson’s R (a measure or correlation between two variables) value of 0.65, suggesting a reasonably strong correlation, but highlighting that there are other factors influencing rideshare participation. In some respects, the price of gasoline may not really be the underlying cause for rideshare behavior changes; rather, it seems likely that tighter household budgets would be more indicative. If one compares the year-over-year change in rideshare participation and per capita disposable personal income (in real terms), one can see that the two move in opposite directions, as one would expect; as disposable income decreases, rideshare participation increases. The Pearson R value is -0.62 suggesting a similarly strong, inverse correlation as was observed between real gasoline prices and rideshare participation. This is an important observation as it may suggest that non-transportation related strains on household budgets (such as an economic downturn, or lower wage growth) are as likely to influence rideshare participation as gasoline prices are. If this hypothesis holds, one should expect to see continued high levels of ridesharing in 2009/2010 due to continued economic weakness, even with the substantial decreases in retail gasoline prices.

History & Statistics Resources

Posted by admin on December 6th, 2009

History:

Statistics:

Workshop Discussion Summary

Posted by admin on May 4th, 2009

Real-Time Rides: The Smart Roadmap to Energy and Infrastructure Efficiency

MIT/CMU Workshop Summary
April 16 – 17, 2009

The MIT / CMU Real-Time Rides workshop took place at MIT in Cambridge, Massachusetts on April 16th and 17th, 2009. The workshop was structured around topic-based sessions. The research team and select workshop attendees framed the topics in each session with short presentations. These presentations were followed by a structured discussion among all participants.

For each workshop session, this report provides a general description of the presentations given and more specific summaries of the group discussions that took place. To the degree possible, we have attempted to identify and emphasize the main themes that resonated throughout the sessions. We acknowledge that not all comments or questions brought up in the sessions are necessarily covered in this summary report. The report concludes by considering potential next steps that could be taken by stakeholders in the ridesharing industry.

Major Workshop Themes:

The two-day workshop covered a variety of topics, but four major ideas or themes emerged as critical to the success of ridesharing.

  1. There is a strong belief that ridesharing is largely dominated by human behavior, preferences and perceptions as travelers make transportation choices. Technology can support rideshare adoption through, for example, added convenience and safety, but it is not sufficient for sustained improvement in rideshare participation. Service and cost characteristics, non-transport incentives and marketing efforts are viewed as critical to rideshare participation.

  2. Additional data and better analysis of rideshare information is needed. This theme focused on the need to understand the size of the rideshare market and the behavior of individuals. Specific behavioral research includes understanding modifications in travel choices influenced by incentives, and responses to changes in variables such as the price of fuel. Some private rideshare providers have indicated a willingness to share their data; similar offers from public agencies would be desirable as well.

  3. Many participants saw the integration of rideshare service information with other modal information as essential to improving rideshare participation. A true multi-modal system should give travelers better opportunities to participate in ridesharing.

  4. The majority of workshop attendees saw some value in an open-source, common data standard for sharing rideshare data with some participants indicating an interest in working collaboratively its development. However, some participants expressed hesitation about a common standard, given that the technology-enabled rideshare market is still in its infancy. Some business models would rely much more heavily on the interchange of information between providers than others would. Ultimately, the importance of combining rideshare information with other modal information may be the most compelling reason for a common standard and rideshare provider collaboration.

Potential Next Steps:

After some consideration of the common interests expressed at the workshop, three areas of further action are suggested. All three of these topics were discussed at varying levels of detail at the end of the second day of the workshop:

  1. Research on Market Size, Travel Behavior: Further research on the potential size of the rideshare market, a better understanding of behavior responses to different incentives and service characteristics, and an understanding of mode choice decisions are all essential. This is perhaps the most pressing action item. Further research will require multiple types of information from a variety of sources. Both academia and rideshare service providers are well suited to take on this task. This requires a willingness on the part of public and private rideshare service providers to share information with the academic community.

  2. Development of a Common Data Standard: The development of a common data standard for exchanging rideshare information among providers and for integration with additional modal information is an important task. Open standards for data interchange are very much recommended. Capacity to work on this standard and the technical “know-how” is concentrated in the private sector and, as such, they should continue to lead the effort. Academia may have some role in encouraging participation and collaboration on a common standard among private and public sector rideshare providers. One mechanism that may strongly encourage development of a common standard would be a pilot, demonstration project involving multiple providers and their systems.

  3. Design a Rideshare Demonstration Project: The design of a US-based demonstration project using advanced rideshare technologies is a long-term endeavor, but an important step towards proving the potential of technology-enabled ridesharing. This task would require seeking out funding sources for such a trial, spending a significant level of effort on the pre- and post- project evaluation procedures, and including well thought out performance metrics. Consideration of the importance of different stakeholders involved is needed, as is how incentives should be structured to generate the desired changes in behavior.

Logistical Information

Posted by admin on April 14th, 2009

Main Building Address:
77 Massachusetts Ave
Cambridge, MA 02139
MIT Campus Map

Once you are at 77 Massachusetts Ave:

  • Enter through the main doorway (large steps and columns)
  • Take the hallway immediately to your right and take the second staircase on the right to the second level
  • Turn right at the top of the stairs and you will see the Spofford Room on your left

Room Locations:
Spofford Room, Building #1, Room #236 (1-236)
Building #3, Room #343 (3-343)
MIT Faculty Club, Building E52, 6th Floor

Contact Information:
Andrew Amey, 703-869-3019, amamey@mit.edu
Valerie Webb, 440-339-3296, vwebb@mit.edu

Directions to MIT
Share a Ride:

Public Transportation: (From the Airport)

  • Take the SilverLine (a Bus Rapid Transit line available outside the terminal near other ground transportation) to South Station
  • From South Station, take the Redline Inbound (towards Alewife) to the Kendall/MIT stop
  • Once at street level, follow Main St towards the Kendall Hotel (away from the river)
  • Left on Vassar St
  • Left on Massachusetts Ave, 77 Massachusetts Avenue will be on the left

Public Transportation: (From Amtrak / South Station)

  • From South Station, take the Redline Inbound (towards Alewife) to the Kendall/MIT stop
  • Once at street level, follow Main St towards the Kendall Hotel (away from the river)
  • Left on Vassar St
  • Left on Massachusetts Ave, 77 Massachusetts Avenue will be on the left

Taxi:

  • Taxi ride will cost somewhere around $25 from the airport, $10-$15 from South Station. Ask to be let out at 77 Massachusetts Avenue

Car: (From the Airport)

  • Take Callahan Tunnel from the Airport roadway
  • Take MA-1A S to Embankment Rd/MA-28/MA-3/Storrow Drive
  • Slight right at Storrow Drive
  • Take ramp on left to Harvard Bridge/MA-2A/Massachusetts Ave
  • Turn right at Harvard Bridge/MA-2A/Massachusetts Ave
  • 77 Massachusetts Avenue will be on the right, just after crossing the river

Parking:

  • Please contact Ms. Ginny Siggia at 617-258-8131 if you will need parking and she will email you a permit for a nearby MIT lot.

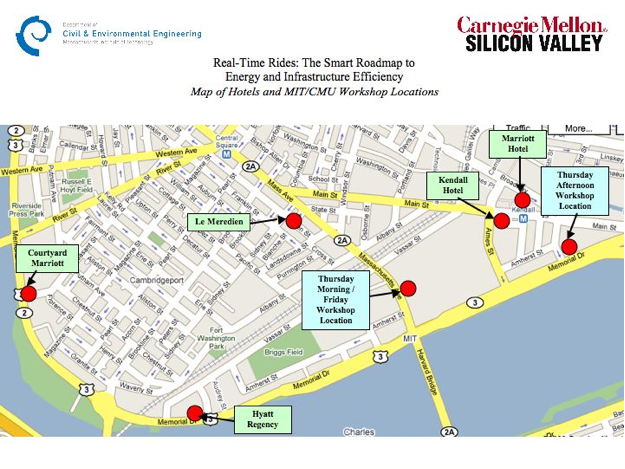
Map of Nearby Hotels and MIT Workshop Locations

Hotels and Workshop Locations

Friday Workshop Agenda

Posted by admin on April 13th, 2009

Friday, April 17, 2009

8:00 – 8:30 am: [Spofford Room, Building #1, Room #236 (1-236)]
Continental Breakfast provided by the MIT Real-Time Rides Research Team

8:30 – 10:00 am: [Building #3, Room #343 (3-343)]
Topic 4: Role of Technology Firms in Supporting Wider Rideshare Participation & Providing Multi-Modal Travel Information
[Moderated by Jim Morris]

  • 8:30 – 8:45 am: (Damien Balsan, Nokia) – Using NFC Phones to Find, Confirm, and Pay for Rides
  • 8:45 – 9:00 am: (Rizwan Khaliq, IBM) – IBM Traffic Prediction and the Provision Traveler Information
  • 9:00 – 10:00 am: Feedback and Discussion on Topic 4

10:00 – 10:45 am: [Building #3, Room #343 (3-343)]
Topic 5: Role of Employers, Universities & Other Institutions in Support of Ridesharing
[Moderated by Eric Schreffler]

  • 10:00 – 10:15 am: (Charlie Crissman, Goose Networks) – Tradeoffs Between Broad Public Programs and Smaller Closed-Loop Programs
  • 10:15 – 10:45 am: Feedback and Discussion on Topic 5

10:45 am – 12:00 pm: [Building #3, Room #343 (3-343)]
Topic 6: Value and Opportunities for a Common Database Feed among Providers
[Moderated by Andrew Amey]

  • 10:45 – 11:00 am: (Carl Gorringe, 511.org) – OpenTrip: An Open Protocol for the Interchange of Travel Information Among Rideshare Providers
  • 11:00 – 11:15 am: (Harvey Appelbe, Avego) – Extending and Applying Open Protocols to Allow Dynamic Travel to Interoperate
  • 11:15 – 12:00 pm: Feedback and Discussion on Topic 6

12:00 – 1:00 pm: [Spofford Room, Building #1, Room #236 (1-236)]
Lunch Provided by the MIT Real-Time Rides Research Team

1:00 – 3:00 pm: [Building #3, Room #343 (3-343)]
Topic 7: Innovative Models for Rideshare Service Provision
[Moderated by Eric Schreffler]

  • 1:00 – 1:15 pm: (John Zimmer and Matt Malloy, Zimride and ZipCar) – Joint carshare-rideshare concept
  • 1:15 – 1:30 pm: (Amol Brahme, iCarpool) – Integration of Real-Time Ridematching with Traditional Carpool and Vanpool
  • 1:30 – 1:45 pm: (Paul Minett, Trip Convergence) – Casual Carpooling as a Model for Real-Time Ridesharing
  • 1:45 – 2:00 pm: (Rob Content, Community Solutions) – Social and Community Aspects of Ridesharing
  • 2:00 – 3:00 pm: Feedback and Discussion on Topic 7

3:00 – 3:30 pm: [Building #3, Room #343 (3-343)]
Workshop Summary and Follow-up Actions: John Attanucci, Rabi Mishalani, & Jim Morris

MIT / CMU Workshop Titles, Abstracts & Presentations

Posted by admin on April 13th, 2009

Thursday, April 16, 2009

Workshop Introduction

Presenter: Michael Messner, Seminole Capital Partners
Title: Ridesharing: NOW is the Time

Setting the Stage: Past and Present Rideshare Markets

Presenter: Valerie Webb & Andrew Amey, MIT
Title: Setting the Stage: Common Themes & Rideshare Trends

Presenter: Jim Morris, Carnegie Mellon Silicon Valley
Title: RideFriends: More Rides, Fewer Cars

Topic 1: Historical Ridesharing Trends and Market Potential

Presenter: Eric Schreffler, Transportation Consultant (ESTC) & Chair, TRB Policy Section
Title: Real-time Ridesharing: A Historic, Heuristic and sometimes Hysteric Perspective
Abstract: Ridematching has been a backbone of efforts to induce commuters to use alternative modes — in this case, sharing their ride within another traveler. Such programs started with manual ridematching before and during WW II. The advent of ICT (information and communications technology) elevated ridematching by introducing computerized ridematching using DIME files for geo-coding. Today, a new set of products is being forwarded using real-time travel data and PDAs. This offers the potential user powerful and useful information on available shared ride opportunities. However, such systems seem to have found a somewhat limited market in occasional, discretionary trip-making. This is clearly a new market for ridesharing, but one that may not maximize the fulfillment of congestion relief, accessibility, air quality and energy goals. So, the question of “is real-time ridesharing effective or cost effective?”, the answer is, unfortunately, “it depends.”

Presenter: Rick Steele, NuRide
Title: Maintaining Ridesharing During an Economic Downturn
Abstract: Gas prices reached all time highs in the summer of 2008, which resulted in dramatic increases in demand for carpooling. However the party ended abruptly in September 2008 as gas prices tumbled, reaching 5-year lows by the end of 2008. At the same time the U.S. economy entered into a severe downturn resulting in increased unemployment and fewer commuters driving to work. So with record low gas prices, rising unemployment and less traffic due congestion, how do you get commuters interested in ridesharing? NuRide will share the results from a series of initiatives it undertook in Houston to combat these macro-economic conditions.

Presenter: Paul Resnick, Professor – University of Michigan School of Information
Title: Assessing Demand Before There’s a Service
Abstract: How good does a ride matching service have to be in order to be utilized?
The answer is critical for assessing whether services have a chance of being adopted, if marketed effectively. But the answer depends on many factors, including regional and individual differences. In response to generic scenarios, riders and drivers may not be able to accurately predict their own future behavior. I will sketch a proposal for demand estimation based on highly personalized scenarios that ask drivers and riders to reflect on their actual recent travel behavior, as automatically recorded by a mobile device.

Topic 2: Behavioral and Attitudinal Characteristics of Travelers – Role of Incentives and How to Overcome Safety & Security Concerns

Presenter: Susan Squires, Technology Research for Independent Living Centre, Trinity College Dublin
Title: Perceptions of the Private Vehicle in the US: Public Identity vs. Private Space
Abstract: Since at least the 1930s (Blumer 1937) researchers have been fascinated by the place and meaning of the automobile in American culture. Almost all studies, however, have focused on the car as a metaphor for, or symbol of individual expression of self, class and role within the public space (Heffner, Turrentine, Kurai 2006). But what about the automobile’s interior space? Do these meanings apply to the private spaces as well as the public? In 2000, I conduct ethnographic research on the uses and associated meaning of the car’s interior spaces. Using Goffman’s concepts of private and public (1956), this presentation explores the differing meaning of the car as a public statement of identity and a private interior space. Understanding the association of private and car interior has consequences for the meaning, and possible success, of ride sharing.

Presenter: Ted Selker, Carnegie Mellon Silicon Valley
Title: Incentives and Improvements in Lifestyle with Ridesharing
Abstract: People commute in cars, rarely meeting the people next to us that are traveling along almost the same route. The same route can be defined in a ridesharing experience as it was in mine: a commitment to be at the same place and time to go with a specific group. This was difficult for me and others to accomplish. This talk will describe a new paradigm in which people have many reasons to meet with others: social, educational, and for transport. The goal will be to set up an economy of experiences that ridesharing will play into. People will express why they might travel with another and when. The economy will value that and attempt to match the experience with the opportunity. People might travel together to study together, discuss a hobby or childrearing.

Presenter: Kursat Ozenc, PhD Student – Carnegie Mellon University
Title: SafeRide: Alternative Ways of Commuting
Abstract: A national survey found that 76% of the working population in United States drives to work by themselves. On average, it takes people 30-40 minutes each way to travel to work. For some people commuting time is an isolated time of the day, blended with stress and anxiety. For others it is an opportunity to relax, and transition between their work and family roles. The goal of this project is to understand both the positive and negative aspects of commuting, and to design a ridesharing service concept that will leverage technology to overcome obstacles that such services have traditionally encountered. We conducted semi-structured interviews with thirty commuters in the Carnegie Mellon University community, including solo drivers, carpoolers and bus riders. We observed that convenience, cost and personal preferences motivate commuting choices. Commuters who talked about convenience were primarily interested in commuting options that allowed them to maintain a flexible schedule. Commuters who talked about cost talked about both time and money spent on commuting. Commuters who talked about personal preferences often mentioned preferences regarding conversation during their commute. Once commuters establish a routine, they tend to continue commuting using their chosen method. We are currently working on design concepts that leverage insights gained from these interviews. We plan to evaluate these design concepts with people who are currently casual carpooling in the Bay area.

Topic 3: Role of Different Levels of Government in Support of Ridesharing

Presenter: Allen Greenberg, FHWA
Title: Lessons Learned about Real-time Ridesharing and Governmental Considerations for Future Support
Abstract: Real-time ridesharing tests have mostly, but not always failed and lessons can be drawn from both successful and failed efforts. The potential benefits of real-time ridesharing are enormous, including enhanced affordable mobility and reduced vehicle-miles traveled, leading to congestion and emissions reductions and infrastructure-cost savings. It is because of these potential benefits that governmental support of dynamic ridesharing may be attracted. Projects proposed for such support must take lessons from previous and on-going effort to heart (including from the successes of casual carpooling) in order to receive favorable consideration.

Presenter: Kay Carson, MassRides / Massachusetts Executive Office of Transportation
Title: Massachusetts: A Statewide Approach to Ride-Sharing
Abstract: The presentation will include a short history of ridesharing in Massachusetts over the past few decades followed by a description of the state’s approach to staffing, marketing, and tools (e.g. phone support, active website, etc.) It will conclude with a discussion of what Massachusetts is looking forward to expand and improve its ride-matching program.

Friday, April 17, 2009

Topic 4: Role of Technology Firms in Supporting Wider Rideshare Participation & Providing Multi-Modal Travel Information

Presenter: Damien Balsan, Nokia
Title: Using NFC Phones to Find, Confirm, and Pay for Rides
Abstract: [Abstract Pending]

Presenter: Rizwan Khaliq, IBM
Title: IBM Traffic Prediction and the Provision Traveler Information
Abstract: The presentation start with a high level overview of IBM’s current Intelligent Transportation Systems (ITS) work, and will follow with a demonstration of the IBM Traffic Prediction solution. This solution is currently in use in Singapore and allows for the prediction of where traffic will occur, prior it to it happening. With the ability to predict events such as heavy traffic congestion and communicate that information to travelers prior to its occurrence, travelers may make more informed choices regarding their mode of travel.

Topic 5: Role of Employers, Universities & Other Institutions in Support of Ridesharing

Presenter: Charlie Crissman, Goose Networks
Title: Tradeoffs Between Broad Public Programs and Smaller Closed-Loop Programs
Abstract: [Abstract Pending]

Topic 6: Value and Opportunities for a Common Database Feed among Providers

Presenter: Carl Gorringe, 511.org Rideshare / Gotalift
Title: OpenTrip: An Open Protocol for the Interchange of Travel Information Among Rideshare Providers
Abstract: This talk will introduce OpenTrip, an open XML data format for exchanging trip data, and a brief look at an example at www.opentrip.info. It will open with a round-table discussion on how we can improve collaboration, why we should use a common data format, how to encourage implementation, and what should be our next steps moving forward. If there is interest, there can also be discussion on the technical details of the current specification.

Presenter: Harvey Applebe, Avego
Title: Extending and Applying Open Protocols to Allow Dynamic Travel to Interoperate
Abstract: This presentation will discuss how to extend protocols to allow many transport modes, such as taxi, shuttle bus, van pool, hourly car rental, scheduled transport (trains, bus), dynamic ride sharing to interoperate, in real-time. It will propose a superstructure that allows interoperable services to register and discover other services.

Topic 7: Innovative Models for Rideshare Service Provision

Presenter: John Zimmer and Matt Malloy, Zimride and Zipcar
Title: Joint Rideshare-Carshare Concept
Abstract: In an era in which increasing numbers of people are turning to the Web and their social networks as the primary way of communicating, organizing their day and planning events, it’s more important than ever to connect our physical world with the virtual world. Zipcar leverages Web, wireless and hardware technologies to make reserving and using a car by the hour as easy as getting cash from an ATM. Zimride leverages the power of social networks, consumer ratings/rankings and Web 2.0 to make finding and sharing a ride a snap. Together, they allow people to build friendships, share experiences, save money and reduce emissions. As leaders in their respective markets, car sharing and ridesharing, Zipcar and Zimride are well poised to co-present current and future ridesharing trends.

Presenter: Amol Brahme, iCarpool – Representing RideShare Online
Title: Integration of Real-Time Ridematching with Traditional Carpool and Vanpool
Abstract: In 1991, Washington State passed a law called the Commute Trip Reduction Law that has shaped transportation demand management programs in the state for the past 17 years. It has driven the development of innovative programs that support reduction in drive alone commuting at the county, city and employer levels. One of these programs RideshareOnline.com, is planning to implement the next generation of ridematch technology in 2009 in the tri-state area of the Pacific Northwest encompassing Washington, Oregon and Idaho.

With the advent of newer technology such as smart phones and SMS, dynamic carpool (also known as real time ridematching) is seeing increased interest from employers, agencies and the public because it provides much needed flexibility which is not found in traditional carpool/vanpool. The presentation compares dynamic carpool with traditional carpool and vanpool in terms of merits and demerits of each. The presentation also covers why neither traditional carpool nor dynamic carpool can solve the user’s needs by itself. The approach taken by RideshareOnline.com is to integrate dynamic carpool trips with traditional carpool trips to increase the potential pool of available matches for both types of trips.

Presenter: Paul Minett, Trip Convergence Ltd
Title: Casual Carpooling as a Model for Real-Time Ridesharing
Abstract: TCL has developed flexible carpooling, a system that builds on casual carpooling and slugging. We will present information about:

  • Casual carpooling
  • Our approach, flexible carpooling
  • The technologies we have developed to facilitate flexible carpooling
  • Other vehicle occupancy raising strategies that the technology supports

Casual car pooling is probably the most effective system of real time ridesharing in existence, accounting for as many as 13,000 rides each day with no pre-arrangement, in 6,500 single use, three person car pools. We will explain why we believe that for increased car pooling the authorities should provide meeting places, not databases.

Presenter: Rob Content, Community Solutions
Title: The Smart Jitney: Rapid, Realistic Transportation Reinvention
Abstract: The Smart Jitney is a system of efficient and convenient ride sharing that addresses in the short-term the problem of transportation in a post-peak oil world. The system utilizes the existing infrastructure of private automobiles and roads due to the time, expense, and difficulty of building a new transportation infrastructure amongst such a dispersed population. The Smart Jitney system would use cell phones and the Internet for ride reservations and coordination. Riders and drivers would have modified cell phones with a GPS function. The goal of the system is to insure that each private car always carries more than one person per car trip, optimally 4-6. This would cut auto gasoline usage by an estimated 80 percent and commute time by an average of 50 percent within two years.

Thursday Workshop Agenda

Posted by admin on April 13th, 2009

Thursday, April 16, 2009

9:30 – 10:00 am: [Spofford Room, Building #1, Room #236 (1-236)]
Registration/Continental Breakfast provided by the MIT Real-Time Rides Research Team

10:00 – 10:30 am: [Building #3, Room #343 (3-343)]
Introduction: John Attanucci (MIT) and Michael Messner (Seminole Capital Partners)

  • Introduction of Organizers
  • Introduction of Participants
  • Workshop Charge and Goals

10:30 – 11:00 am: [Building #3, Room #343 (3-343)]
Setting the Stage: Past and Present Rideshare Markets

  • 10:30 – 10:45 am: (Andrew Amey and Valerie Webb, MIT) – Statistics and Historical Trends
  • 10:45 – 11:00 am: (Jim Morris, CMU West) – RideFriends: More Rides, Fewer Cars

11:00 am – 12:30 pm: [Building #3, Room #343 (3-343)]
Topic 1: Historical Ridesharing Trends and Market Potential
[Moderated By Jim Morris]

  • 11:00 – 11:15 am: (Eric Schreffler, Consultant) – Real-time Ridesharing: A Historic, Heuristic and sometimes Hysteric Perspective
  • 11:15 – 11:30 am: (Rick Steele, NuRide) – Maintaining Ridesharing During an Economic Downturn
  • 11:30 – 11:45 am: (Paul Resnick, University of Michigan) – Assessing Demand Before There’s a Service
  • 11:45 – 12:30 pm: Feedback and Discussion on Topic 1

12:30 – 1:45 pm: [Spofford Room, Building #1, Room #236 (1-236)]
Lunch Provided by the MIT Real-Time Rides Research Team, Walk to MIT Faculty Club

1:45 – 3:15 pm: [MIT Faculty Club, Building E52, 6th Floor]
Topic 2: Behavioral and Attitudinal Characteristics of Travelers – Role of Incentives and How to Overcome Safety and Security Concerns
[Moderated by Rabi Mishalani]

  • 1:45 – 2:00 pm: (Susan Squires, Trinity College) – Perceptions of the Private Vehicle in the US: Public Identity vs. Private Space
  • 2:00 – 2:15 pm: (Ted Selker, CMU West) – Incentives and Improvements in Lifestyle with Ridesharing
  • 2:15 – 2:30 pm: (Kursat Ozenc, CMU) – Saferide: Alternative Ways of Commuting
  • 2:30 – 3:15 pm: Feedback and Discussion on Topic 2

3:15 – 4:15 pm: [MIT Faculty Club, Building E52, 6th Floor]
Topic 3: Role of Different Levels of Government in Support of Ridesharing
[Moderated by John Attanucci]

  • 3:15 – 3:30 pm: (Allen Greenberg, FHWA) – Lessons Learned about Real-time Ridesharing and Governmental Considerations for Future Support
  • 3:30 – 3:45 pm: (Kay Carson, MassRides / Massachusetts EOT) Massachusetts: A Statewide Approach to Ride-Sharing
  • 3:45 – 4:15 pm: Feedback and Discussion on Topic 3

4:15 – 6:00 pm: [MIT Faculty Club, Building E52, 6th Floor]
Service Provider Presentations on history of their company, interest in ridesharing, demonstration of their product, and vision of the future

6:00 – 6:45 pm: [MIT Faculty Club, Building E52, 6th Floor]
First Day Wrap-up & Pre-Dinner Drinks

6:45 pm: [MIT Faculty Club, Building E52, 6th Floor]
Dinner at the MIT Faculty Club provided by the Real-Time Rides Research Team

Confirmed Workshop Attendees

Posted by admin on March 25th, 2009

Confirmed Attendees (37):

  1. Carl Gorringe, 511.org Rideshare / Gotalift
  2. Harvey Appelbe, Avego by Mapflow
  3. Jason Conley, Avego by Mapflow
  4. Marianne Tyrrell, British Consulate-General – Science and Innovation Team
  5. Neelangi Gunasekera, British Consulate-General – Science and Innovation Team
  6. Jim Gascoigne, Charles River Transportation Management Association
  7. Ted Selker, Prof – Carnegie Mellon Silicon Valley, Associate Director of Mobility Research
  8. Kursat Ozenc, PhD Student – Carnegie Mellon University
  9. Steffen Frost, Carticipate
  10. Darius Roberts, Carticipate
  11. Ross Edgar, CommuterConnections
  12. Stephen Finafrock, CommuterConnections
  13. Allen Greenberg, Federal Highway Administration
  14. Antoine Averseng, French Embassy (US) – Trade Office
  15. Robin Chase and/or Mark Chase, GoLoco
  16. Roy Russell, GoLoco
  17. Charlie Crissman, Goose Networks
  18. Rizwan Khaliq, IBM – Intelligent Transportation Systems & Emerging Markets
  19. Amol Brahme, iCarpool
  20. David Grennan, Independent Consultant – Ireland
  21. Kay Carson, MassRides
  22. Leon Papadopolous, MassRides
  23. Larry Brutti, MIT Parking & Transportation Office
  24. Rob Content, Morgan Institute for Community Solutions
  25. Damien Balsan, Nokia
  26. Rick Steele, NuRide
  27. [Potential Representative], PickupPal
  28. Jeffrey Chernick, RideAmigos
  29. Michael Messner, Seminole Capital Partners
  30. Susan Squires, Technology Research for Independent Living Centre, Trinity College Dublin
  31. Eric Schreffler, Transportation Consultant (ESTC) & Chair, TRB Policy Section
  32. Paul Minett, Trip Convergence, Ltd.
  33. Kristin Lovejoy, PhD Student – University of California, Davis
  34. Paul Resnick, Prof – University of Michigan
  35. Holly Parker, Yale University
  36. John Zimmer, ZimRide
  37. Matt Malloy, Zipcar

MIT / CMU Rideshare Research Team (5):

  1. Jim Morris, Carnegie Mellon Silicon Valley
  2. John Attanucci, MIT Rideshare Research
  3. Rabi Mishalani, Ohio State University
  4. Andrew Amey, MIT Rideshare Research
  5. Valerie Webb, MIT Rideshare Research

Summary of Carpool Trends

Posted by admin on February 24th, 2009

This summary is certainly not comprehensive, it is a simple tally of the trends described above.

1. Ridesharing has a strong cultural and social aspect to it. The largest group of ridesharers are family members, co-workers and neighbors. Certain groups, namely Hispanic-Americans, share a large proportion of rides in the US.

2. Changes in Disposable Personal Income, whether due to higher gasoline prices, lower overall earnings or an economic downturn, appear to have a significant effect on aggregate rideshare participation. Rideshare surveys tend to support this finding, with participants often listing cost savings as one of the three main reasons for sharing rides.

3. At an aggregate level, rideshare participation appears to be higher in low density metropolitan areas, but the reasons for this are not entirely clear. Intuitively, ridesharing requires at least some density of riders with similar origins and destinations in order to work. However, higher densities are often accompanied by larger and more interconnected transit systems that may compete for rideshare participants. For lower density metropolitan areas, ridesharing may function as a type of small vehicle transit.

4. Ridesharing and transit are likely complements and substitutes. The international analysis of transit share and rideshare participation suggest (at a very high level) a potential substitution between the two modes, however the metropolitan analysis did not show any significant trade-off between transit share and ridesharing in the US context. There is evidence from San Francisco that people who choose to rideshare previously rode transit, suggesting that the two modes are substitutes. On the opposite side, evidence from Seattle, San Francisco & Washington DC suggest that when passengers cannot find an appropriate ride-match, they rely on transit services to reach their desired destination, suggesting that the two modes complement one another.

International Commute Mode Shares

Posted by admin on February 24th, 2009

It may surprise some to learn that ridesharing as a percentage of commute mode share in the US is relatively high compared to other developed countries. The table below shows the mode split for commute trips for the US, Canada, the UK and Australia. The US has a substantially higher level of ridesharing than any of the other three nations. It is interesting to note however, that all three other nations have substantially higher public transit mode shares than the US does. If the two modes (carpool & public transit) are considered together, the combined share is quite similar across all countries. This may suggest that the two modes compete with one and other, as suggested at several points on the website. Further, this assertion is supported by the fact that the strongest rideshare markets in the US have relatively low transit shares, and vice versa.

Non-Commute Carpooling

Posted by admin on February 24th, 2009

All of the statistics quoted thus far have been based on Home based Work (HBW) trips, or commute trips in other words. Looking at carpool and vehicle occupancy rates for all trips (including HBW) shows a very different story. According to the 2001 NHTS, multi-occupant vehicle trips (i.e. carpool trips) account for 48.9% of trips as compared to 12.6% of work-only trips. This is an interesting fact to consider when developing a rideshare strategy. While lower occupancy HBW trips and work-related trips only account for 16% of total trips in the US, they cause a disproportionately high percentage of the congestion experienced nationwide. Shifts from SOV to HOV for weekday commute trips are likely to have larger positive impacts on congestion than similar shifts in non-commute trips. This would seem to suggest that ridesharing initiatives should focus on commute-based trips.

Occupancy for different trip purposes is only one aspect of capacity utilization; one must also consider differing trip lengths by trip purpose. The following chart shows total annual seat miles of unused capacity per vehicle for different trip types. So while only 16% of total trips nationwide are commute trips, they represent 33% of total seat-miles of unused vehicle capacity (and 46% of peak period seat-miles of unused vehicle capacity). This reinforces the previous belief that ridesharing initiatives should focus on commute-based trips. However, one should also consider the differing values of time that users place on different trip types. Commute trips are likely to have a higher value of time for most drivers, thereby making any inconvenience or delay in their journey incredibly onerous. If ridesharing is to be improved during the commute, convenience for drivers and passengers, and minimal delays are essential.

Personal Income and Carpool Mode Share

Posted by admin on February 24th, 2009

There is a believe that carpooling has an inverse relationship with personal income; as income increases, families purchase additional vehicles, single occupant vehicle trips increase and carpool participation decreases. Indeed, national level journey to work data shown in the chart below confirms this inverse relationship between personal income and carpool share; carpooling as a share of mode split decreases as income increases. This is in contrast to transit mode share, which first decreases with increasing income, but increases in the higher personal income brackets.

The metro-level relationship between personal income and carpool share is basically the same as the national level trend. In almost all cases, metro region carpooling decreases steadily with increasing income. Dallas-Fort Worth, TX is a good example of this. Carpool mode share for those making less than $25K is nearly 20%, yet decreases to just over 5% for those making more than $75K. Washington, DC is interesting in that it is one of only two cities in which carpool mode share increases (albeit marginally) in the highest income bracket. Seattle, WA is perhaps the most interesting metro are from a carpool mode share standpoint. Its carpool share remains remarkably consistent over all income brackets, only showing a noticeable decrease for those in the highest income bracket. It is likely that Washington state’s Commute Trip Reduction legislation for large employers explain some of Seattle’s higher than average carpool mode share in higher income brackets.

When the metropolitan level data is analyzed over time, the income trend is not significantly different; the change in inflation-adjusted household income at the metropolitan level has a discernible, but varied impact on carpool mode share. One can certainly see that decreases in carpooling have commonly occurred when household incomes have risen (top-left quadrant) however there are instances when decreases in carpooling have been associated with decreases in income (bottom-left) and more recently, increases in carpooling have been observed when income has increased (top-right).

While it appears that there is a substantial change in mode share in the 1980’s as compared to the 1990’s, one should remember that the 1980 Census would have been taken during a period of high gas prices resulting from the 1970’s Energy Crises. With the sharp decrease in gasoline prices in the 1980’s, it is not surprising that the carpool share showed a large decrease across many metropolitan areas.

Overall, the data suggests that increasing levels of income are associated with a decrease in carpool mode share, both at the national and metropolitan levels.

New Americans & Carpooling

Posted by admin on February 24th, 2009

In 2000, foreign-born commuters accounted for slightly less than 14% of the working population, yet they made up nearly 20% of the share of 2-person carpools and over 40% of the share of carpools with 5 or more people.

However, it would be incorrect to characterize carpooling as simply a domestic vs. foreign issue. The evidence suggests that recent immigrants are much more likely to carpool than those foreign-born residents that have lived in the US for some time.

Ignoring length of time in the US for the time being, the 2000 Census data also shows that the incidence of carpooling is much higher among Hispanic Americans than it is for any other ethnic group. White, non-Hispanic Americans’ carpool share is only 10% for commute trips while the share for African Americans is 16% and the share for Hispanic Americans is 22%. This finding begins to explain the high rideshare mode splits in the metro areas of the US Southwest where Hispanic populations are more highly concentrated.

The high share of carpool activity attributed to recent immigrants and Hispanics leaves an interesting question unanswered. Is the initial high participation rate in carpools due to an inability to purchase a private vehicle (for financial reasons or otherwise), cultural factors related to shared vehicle transport, some combination of the two or other factors entirely?

“Fampools” and Social Trust

Posted by admin on February 24th, 2009

In 2000, 77% of nationwide carpools involved two individuals (the driver and one passenger). Of these two-person carpools, it is believed that 25-80% are “fampools”, carpools comprised of family members, depending largely on trip type.

Attanucci (1974), in a survey of commuter carpooling in Boston, places the percentage between 25-45%, with co-workers representing another 50-70%. Kendall (1975), in a survey of Boston commuters found that 35% of carpools were intra-household. However, recent sources place the percentage of commuting involving family members much higher. Pisarski (2006) suggests the percentage is closer to 80% but provides no supporting evidence. Li (2007) in a survey of Texas carpoolers found that approximately 65% were family members, with co-workers representing another 30%. Morency (2007) using survey data from Montreal, Canada found that 82% of carpoolers were family members with another 9% representing co-workers.

Note that the Attanucci and Kendall surveys, while several decades earlier, were surveys of commuter carpoolers specifically, and found a much lower share of household members and a much higher share of co-workers. The Li and Morency surveys focused on all trip types and found much higher intra-household participation.
Intuitively, it is expected that commuting trips would involve smaller percentages of family members than trips for other purposes. Carpool statistics from MIT tend to support this; approximately 59 of 234 employees (25%) with registered carpool parking permits are family members. Note that this percentage is an understatement of true “fampools” at MIT, because employees that are dropped off at campus by a family member cannot be identified through parking permit registration. However, the statistics certainly suggest that “fampooling” for commuting trips is much lower than the 65-80% quoted elsewhere.

Beyond considerations of trip type, it is clear that the percentage of carpooling occurring between unknown participants is rare; Attanucci (1974) found 3%, Li (2007) found 3-5% and Morency (2007) found approximately 9%.

Metropolitan Density, Transit Share & Congestion

Posted by admin on February 24th, 2009

As was seen in the previous section, geographic differences within the US appear to have some effect on rideshare participation. One potential reason for this is differences in metropolitan population densities. Cities in the Northeast developed much sooner than cities in the South and West, and were not originally designed to accommodate private automobiles. The chart below suggests that density may have an influence on carpool mode choice; as population densities increase, carpool mode share falls. What this chart does not provide any information on is whether density itself leads to decreasing carpool mode share, or whether higher densities improve the viability of other modes of transportation (such as transit) leading to a mode shift away from carpool.

Indeed, if one considers both carpool and transit mode shares and compares it to metropolitan density, the picture becomes a bit clearer. At higher densities, transit is the dominant mode choice (low carpool / transit ratios) while at lower densities carpool is the dominant mode choice (high carpool / transit ratios). Intuitively this makes some sense if one believes that higher population densities are a prerequisite for viable transit service.

[Note: The density calculations in the two previous graphs were done at the MSA level. MSA's in the US are determined by county boundaries rather than any sort of density gradient. As such, MSA's that include large counties with a primarily rural population (many in US Southwest, for example) will have lower densities than their actual urbanized area.]

One of the implications of the previous charts is that carpool and transit appear to compete for mode share. As we’ll see later on in the International section, this appears to be at least somewhat true at an aggregate level. However, its important to realize that this relationship is anything but certain. The chart below plots metro region carpool and transit shares against one and other. If the relationship between carpool and transit were strong, we would expect to see a pattern of dots sloping from top-left to bottom-right. In actuality, the data does not show any particular relationship between carpool and transit mode share at the metropolitan level.

Shifting from the relationship between transit and ridesharing to congestion and ridesharing, we see that at the aggregate level there is a consistent, positive trend. Those metro areas with higher levels of congestion generally have higher carpool mode shares. The trend is more pronounced for large metro areas than it is for smaller ones.

For metro areas with HOV facilities, the presumption is that as metro level congestion increases, commuters form carpools to take advantage of less congested HOV lanes. In these cases, there is an obvious travel-time savings benefit for the driver and probably for the passenger. In instances where HOV lanes are not present, the impetus for carpool formation is less clear. The argument has been made that some commuters choose to ride as a passenger in heavily congested situations to avoid the stress of driving. From an economic standpoint, there is less of an impetus when HOV lanes are not present. This may also explain the lack of trend in the small and medium metro areas; although no analysis was performed, one can assume the majority of freeway HOV facilities are found in the larger US metro areas.

Geographic Changes in Mode Share

Posted by admin on February 24th, 2009

The geographic changes in ridesharing from 1990 to 2000 are quite pronounced. During the decade, only four metro regions of over 1 Million people had increases in carpool mode share and they were predominantly west of the Mississippi (Seattle, Phoenix & Dallas. Atlanta was the fourth). The map below paints an interesting story. While carpool mode share has been decreasing nationwide, the largest decreases have been in the eastern US. At the metropolitan level, the results are even more pronounced; of the top 10 metro regions with the highest carpool mode shares in 2000, eight are located in the US Southwest (CA, NV, AZ, NM & TX). The 10 metro regions with the lowest carpool mode shares were all in the Northeast (NY, MA, CT) and the Upper Midwest (OH, MI, PA). It is also interesting to note that the two metro regions that are frequently cited as examples of carpool success stories (San Francisco & Washington, DC) rank 16th and 21st respectively in terms of carpool mode share. Ironically, three cities often criticized for their reliance on the private automobile (Phoenix, Los Angeles & Las Vegas) have the highest proportion of carpool commuters in the US.
[Note that this analysis was limited to metro areas with 500,000 commuters or more]

Mode Share by Metropolitan Size

Posted by admin on February 24th, 2009

In stark contrast to transit use, carpool mode share is very consistent across metropolitan areas of different sizes. Not surprisingly, non-metropolitan region (rural) journey to work trips had a higher carpool share, as these commuters likely have longer commutes, have fewer transport options and are more likely to achieve cost savings from carpooling. Overall, this finding seems somewhat counterintuitive; one would have expected non-metro regions and large metro regions to have higher shares, as commuters in these areas are more likely to benefit from ridesharing through reduced fuel consumption and travel time savings. Although only speculation on our part, the lower-than-expected carpool mode share in large metro regions may be partly due to the larger transit service offerings.

Historical Trend – Journey to Work

Posted by admin on February 24th, 2009

Ridesharing as a mode of travel to work was relatively popular in 1970 and 1980, accounting for approximately 20% of work trips. The 1980’s were difficult for ridesharing; by 1990, nationwide rideshare participation had decreased by 3.6 Million commuters and mode share dropped to approximately 13%. Ridesharing reversed somewhat in the 1990’s and by 2000 had added back 250,000 participants. This increase however did not keep pace with the overall growth in commuters resulting in a decrease in mode share to just over 12% of trips to work in 2000. The downward percentage trend continued in the early 2000’s but appears to have reversed course by 2006, likely due to increasing petroleum prices.

Provider Database Search Redirect

Posted by admin on February 24th, 2009

Name of Service Provider;Address;E-mail;Phone;Contact Person;Web Link;Summary Sheet;Type of Organization;Geographic Coverage;Geographic Market – City;Geographic Market – State;Carpools Vanpools Both?;Level of Participation;Type of Rideshare Trip;Source of Funding;Trip Cost;Communication Mediums Used;Rider Matching Technology;Route Matching Technology;Employer Connection;Vehicle Ownership /Fleet Size;Incentives;Agreements / Collaborations with Other Rideshare Providers;Integration with Other Commute Information Sources;Additional Information
511.org Rideshare;101 Eighth St Oakland CA 94607;;510-817-5700;;”Website“;”Summary Sheet“;Local/Regional Agency;Local/Regional;San Francisco;CA;Both;;Commuting Trips;;Monthly Fee (Vanpools);Website;Automated Matching: Pre-Planned Trips;Origin/Destination;Consultations Marketing and outreach Worksite events Employee surveys;Vans can be leased from third party;Earn money for a commute diary;;;
ABC TMA RideMatch;33 Broad St Suite 300 Boston MA 02109;;617-502-6246;;”Website“;”Summary Sheet“;Local/Regional Agency;Local/Regional;Boston;MA;Both;;Commuting Trips;;;Website;Automated Matching: Pre-Planned Trips;Along the Route;28 Employers;;Cash prizes Guaranteed Ride Home;Vanpools found through GoLoco;Website links to Massachusetts Bay Transit Authority AAA and the Executive Office of Transportation;Collaboration with MassRides
AdVANtage Vanpool Program;1350 East 17th St Kansas City MO 64108;”dbrown@kcata.org“;816-346-0800;;”Website“;”Summary Sheet“;Local/Regional Agency;Local/Regional;Kansas City;MO;Vanpools;;Commuting Trips;;Monthly Fee;Mail / E-Mail;Automated Matching: Pre-Planned Trips;Origin/Destination;;Owns Vans;Guaranteed Ride Home;;Run by Kansas City Area Transportation Authority which also runs bus and light rail in the area;
AlterNet Rides;;”alternetways@alternetrides.com“;925-952-4519;;”Website“;”Summary Sheet“;Private;National;;;Both;1693 public rides listed;All Trips;Other – fee from organizations;;Website;Notice Board;;Provides ridematching services to employers;;;;;Provides free service to churches and other places of worship
Avego (by Mapflow);1 Kinsale Commercial Park Kinsale County Cork Ireland;”info@avego.com“;+353 (0) 21 477 3833;Sean OSullivan;”Website“;”Summary Sheet“;Private;International;;;Carpools;Several Thousand Downloads;All Trips;Commission;Cost per Mile;iPhone / Website;Automated Matching: Real-Time;Along the Route;Versions of the Avego software offered on Windows Mobile and Linux platforms for corporate clients;;;;Currently working on a combined transit/rideshare information service in Madrid Spain;
Bay Area Commuter Services;1408 N Westshore Blvd Suite 704 Tampa FL 33607;”TampaBayRideshare@atlantic.net“;813-282-8200;;”Website“;”Summary Sheet“;Non-Profit;Local/Regional;;FL;Both;;Commuting Trips;;;Mail / E-Mail;Automated Matching: Pre-Planned Trips;Origin/Destination;Employer Commute Assistance: zip code maps of where employees live dedicated parking for carpool/vanpool install bike racks;;Emergency Ride Home;;Links to all area transit;Run by Bay Area Commuter Services which is one of nine Florida commuter assistance programs. Funded by FL DOT
Capitol Rideshare;100 North 15th Avenue Suite 431 Phoenix AZ 85007;”adrides@azdoa.gov“;602-542-7433;;”Website“;”Summary Sheet“;State Agency;State;;AZ;Both;;Commuting Trips;;Monthly Fee (Vanpools);Website;Automated Matching: Pre-Planned Trips;Along the Route;State Employees Only;;Carpool Parking Permits Emergency Ride Home Discounts;;;Program is specifically for Arizona State Employees
Carpool.ca;;”information@carpool.ca“;;Anne Marie Thorton;”Website“;”Summary Sheet“;Private;National;;;Carpools;;Commuting Trips;Funded by numerous city governments;;Website;;;Manages over 120 employer rideshare programs;;”Sponsors annual “”Rideshare Week”" which includes prize drawings for new registrants”;;;
Carpool Connect;;;;;”Website“;”Summary Sheet“;;National;;;Carpools;;All Trips;;;Website;Automated Matching: Pre-Planned Trips and Notice Board;Origin/Destination;;;;;;
Carpool Crew;;”contact@carpoolcrew.com“;;;”Website“;”Summary Sheet“;;National;;;Carpools;;Commuting Trips;;;Website;Automated Matching: Pre-Planned Trips;Origin/Destination;Employers can advertise Carpool Crew on their website;;;;;Users can leave feedback on travel partners
Carpool Match NW;;”feedback@carpoolmatchnw.org“;;;”Website“;”Summary Sheet“;State Agency;Local/Regional;;OR WA;Carpools;11 500 registered users;All Trips;;;Website;Automated Matching: Pre-Planned Trips;Origin/Destination;Provides Promotional Brochures for paychecks ads and posters;;Prize sweepstakes;Link to MidValley Rideshare;Links to TriMet C-Tran SMART Transit Sandy Transit Salem Area Mass Transit District Flexcar Bicycle Transportation Alliance Willamette Pedestrian Coalition Vancouver Bicycle Club;Sponsored by Metro in cooperation with City of Portland Office of Transportation South Metro Area Rapid Transit TriMet and Rogue Valley Transit District
Carpool World;;;;Max Fox and Isabelle Boulard;”Website“;”Summary Sheet“;Private;International;;;Carpools;82 378 registered trips;All Trips;Advertising and Other (fees from organizations);;Website;Automated Matching: Pre-Planned Trips;Along the Route;Employers can form private groups;;;;;Carpool world has a patent on their matching algorithm
Carticipate;3720 Scott Street San Francisco CA 94301;”contact@carticipate.com“;415-912-1221;Steffen Frost;”Website“;”Summary Sheet“;Private;International;;;Carpools;15 000 downloads;All Trips;Other – Revenue from other iPhone Apps;;iPhone / Website;Automated Matching: Real-Time;Origin/Destination;;;;;;
Commuter Connections;777 North Capitol Street NE Suite 300 Washington DC 20002;;1-800-745-RIDE;Nick Ramfos;”Website“;”Summary Sheet“;Local/Regional Agency;Local/Regional;;Washington DC MD VA;Both;20 000 riders;All Trips;;;Website;Automated Matching: Pre-Planned Trips and Notice Board;Origin/Destination;Employer Services Representatives;;Guaranteed Ride Home;Links to all area ridesharing/vanpooling programs;Suggests offering subsidized SmarTrip cards (transit passes);Run by a network of over 30 organizations (federal regional state)
Commuter Link;;”info@commuterlink.com“;1-866-NYCOMMUTE;;”Website“;”Summary Sheet“;State Agency;Local/Regional;New York City;NY;Both;;Commuting Trips;;Monthly Fee (Vanpools);Website;Automated Matching: Pre-Planned Trips;Origin/Destination;Specific website for employers – http://employers.commuterlink.com;;Guaranteed Ride Home;;CommuterLink will provide customized transit routes complete with schedules and maps;Non-Profit funded by New York State DOT and supported by NYC Department of Transportation
Commuter Resource RI Rideshare;265 Melrose St Providence RI 02907;;401-781-9400;;”Website“;”Summary Sheet“;State Agency;State;;RI;Carpools;;All Trips;;;Website;Notice Board;;;;Guaranteed Ride Home;Powered by Alternet Rides;Run by Rhode Island Public Transit Authority;
CommuteSmart;1731 First Avenue North Suite 200 Birmingham AL 35203;”ssaffle@rpcgb.org“;1-87-RIDEMATCH;Sean Saffle;”Website“;”Summary Sheet“;Local/Regional Agency;Local/Regional;;AL;Both;;Commuting Trips;;Monthly Fee (Vanpools);Website;Automated Matching: Pre-Planned Trips;Origin/Destination;”"”Employer Link”" Provided”;;Cash and Gift Card Rewards;;;CommuteSmart operates statewide but directed by Regional Authorities
Compartir S.L. ;C/ Gavatxons 3 – 2 08221 Terrassa;”control@compartir.org“;34-937-891-106;;”Website“;”Summary Sheet“;;International;;;Carpools;;All Trips;;;Website;Automated Matching: Pre-Planned Trips;Along the Route;;;;;;
Covoiturage;;”thomas.herlin@covoiturage.com“;33(0)6 62 31 25 88;Thomas Herlin;”Website“;”Summary Sheet“;Private;International;;;Carpools;219 940 registered users;All trips;Advertising and Other (fees from organizations);;Website;Notice Board;;Organizations can pay a fee for a Covoiturage-run ridesharing application on their website;;;;;
DriJo GmbH;Mountain View CA and Lenzau 1 84558 Kirchweidach Germany;;1-650-276-0383 498623-218330;Walter Demmelhuber and Peter Sabalat;”Website“;”Summary Sheet“;;International;;;Carpools;;All Trips;;Other – Auction;Website;Notice Board;Along the Route;;;;;;
Drive2Day;;;;;”Website“;”Summary Sheet“;;International;;;Carpools;;Inter-City Trips;;;Website;Automated Matching: Pre-Planned Trips;Along the Route;Module and Program Available to Employers;;;;;Users can leave feedback on travel partners
Drive Time Des Moines;;”info@drivetimedesmoines.org“;515-286-4969;;”Website“;”Summary Sheet“;Local/Regional Agency;Local/Regional;Des Moines;IA;Both;;Commuting Trips;;;Mail / E-Mail;Automated Matching: Pre-Planned Trips;Origin/Destination;;;Rest Your Car – monthly and quarterly prize drawings;;Links to all area transit;Funded by Des Moines Area MPO Downtown Community Alliance City of Des Moines and Des Moines Regional Transit Authority
Easy Street;100 Corporate Drive Suite 120 Windsor CT 06095;”CS@rideshare.com“;1-800-972-3279;;”Website“;”Summary Sheet“;Non-Profit;State;;CT;Vanpools;300 daily routes with 3000 daily riders;Commuting Trips;;Monthly Fee;Website;Notice Board;;;Owns Vans;Cash rewards for referring new riders Emergency Ride Home;Run by The Rideshare Company;;Sponsored by Connecticut DOT
Ecolane Dynamic Carpool;Mets‰nneidonkuja 10 2130 Espoo Finland;”sami.poykko@ecolane.com “;+358 9 72 554 272;Sami Poykko;”Website“;”Summary Sheet“;Private;International;;;Carpools;;All Trips;;;Java-enabled Mobile Phones;;;Appears to be marketed to employers & public agencies;;;;;
eRideshare;PO Box 402 Edwardsville IL 62025;”info@erideshare.com“;618-530-4842;;”Website“;”Summary Sheet“;Private;International;;;Carpools;20409 daily carpools 967 cross country trips 151 other trips;All Trips;;;Website;Notice Board;;Employers can make their own carpooling group;;;;;
Freewheelers Ltd;;”web.info@freewhelers.co.uk“;;Daniel Harris;”Website“;”Summary Sheet“;Non-Profit;International;;;Carpools;316 rider requests 103 driver requests;All Trips;Other – Donations;;Website;Notice Board;;;;;;;
GishiGo Ride Share Network;;;San Francisco: 415-223-4243 New York: 718-690-7290;;”Website“;”Summary Sheet“;Private;International;;;Carpools;;Non-Work Trips;Commission;;Website;Notice Board;;;;;;;Users can leave feedback on travel partners
Goose Networks;216 1st Ave S Suite 450 Seattle WA 98104;”zac@goosenetworks.com“;206-57-GOOSE;Zac Corker;”Website“;”Summary Sheet“;Private;National;;;Carpools;;Commuting Trips;Commission (per employer);;Website;Automated Matching: Pre-Planned Trips;Along the Route;Works strictly with employers – not with individual commuters;;;;;Provides management tools to employers regarding commute options
GoLoco;40 Cottage St Cambridge MA 02139;”support@goloco.org“;617-395-2643;Robin Chase;”Website“;”Summary Sheet“;Private;National;;;Carpools;15 000 registered;All Trips;Commission;Cost per Mile;Website;Automated Matching: Pre-Planned Trips;Along the Route;Employers can make their own carpooling group and/or provide GoLoco chicklet on their site;;Most employers offer preferred parking;;;Members can select who sees their post Facebook application also available
Go Vermont – Connecting Commuters;;;1-800-685-RIDE;;”Website“;”Summary Sheet“;State Agency;State;;VT;Both;4000 registered users;Commuting Trips;;Monthly Fee (Vanpools);Website;Automated Matching: Pre-Planned Trips;;;Vans leased from VPSI;Emergency Ride Home;Vanpools provided by VPSI;;
GreenRide;368 Pleasant View Drive Lancaster NY 14086;”greenride@ene.com“;1-877-GR-RIDE-1;;”Website“;”Summary Sheet“;Private;International;;;Both;;Commuting Trips;;;Website;Automated Matching: Pre-Planned Trips;Along the Route;Used by various employers all over the US Canada and New Zealand;;;;;Ridesharing package that is solicited to MPOs TMAs Corporations Campuses Air Quality Management Districts
Hawaii DOT Rideshare Program;601 Kamokila Boulevard Room 602 Kapolei HI 96707;”rideshare@hawaii.gov“;808-692-7695;;”Website“;”Summary Sheet“;State Agency;State;;HI;Carpools;;Commuting Trips;;;Mail / E-Mail;Automated Matching: Pre-Planned Trips;Origin/Destination;;;;;Links to The Bus (area bus service) and Leeward Oahu TMA (LOTMA);
Hitchhikers.org;;”info@hitchhikers.org“;;;”Website“;”Summary Sheet“;Private;International;;;Carpools;124 Rides listed;Inter-City Trips;Other – Donations;;Website;Notice Board;;;;;;;Capability to be international but only has European trips posted
iCarpool – Interact Soft Inc;;”support@icarpool.com“;425-369-6136;Amol Brahme;”Website“;”Summary Sheet“;Private;International;;;Both;Works with 50 organizations plus individual travelers;All Trips;Advertising and Other (fees from organizations);;Website;Automated Matching: Pre-Planned Trips and Real-Time;;Work with 50 clients from organizations universities and regional/local planning agencies;;Guaranteed Ride Home;;Software can integrate with transit schedules;
Jack Bell Ride-Share for BC;700 West 57th Ave Vancouver BC Canada V6P 1S1;”info@ride-share.com“;1-888-380-RIDE;;”Website“;”Summary Sheet“;Private;Local/Regional;;British Columbia Canada;Both;5 000 registered users;Commuting Trips;;Monthly Fee (formal rideshare);Website;Automated Matching: Pre-Planned Trips;;Can search by employer on the homepage with 58 employers listed;Owns a fleet of cars and vans;;;;Designates trips as Casual and Formal Ridesharing. Casual – use personal vehicle due to irregular work schedule Formal – use Jack Bell owned vehicle
Leeward Oahu TMA Carpool Service;;”lotma@lava.net“;808-677-RIDE;;”Website“;”Summary Sheet“;Local/Regional Agency;Local/Regional;Oahu;HI;Carpools;;Commuting Trips;;;Mail / E-Mail;Automated Matching: Pre-Planned Trips;;;;Emergency Ride Home;Links to DOT website for more carpool information as well as erideshare.com and carpoolworld.com;Links to LOTMA Commuter Express (bus) The Bus and Mililani Trolley Vanpool Hawaii;
Lexington-Fayette Urban County Government Rideshare Program;200 East Main Street Lexington KY 40507;”rdaman@lfucg.com“;859-233-POOL;;”Website“;”Summary Sheet“;Local/Regional Agency;Local/Regional;;KY;Both;;Commuting Trips;;;Mail / E-Mail;Automated Matching: Pre-Planned Trips;;;;Guaranteed Ride Home;;Link to Lextran (transit authority or LFUCG and Lexington KY);Also provide a bicycle program
Liftshare;Butterfly Hall Attleborough Norfolk England NR17 1AB;”info@liftshare.com“;44(0)8700-780225;Ali Clabburn;”Website“;”Summary Sheet“;Private;International;;;Carpools;71 610 235 trips registered for the next 12 months 32% of registered journeys result in matches;All Trips;Other – fee from employers;;Website;Automated Matching: Pre-Planned Trips;Along the Route;Employers can form private groups for their employees see liftsharesolutions.com;;;;liftshare also has WalkBUDi BikeBUDi and TaxiBUDi;
Local Motion Rideshare;301 King Street Room 1200 Alexandria VA 22314;”localmotion@alexandriava.gov“;703-838-3800;;”Website“;”Summary Sheet“;Local/Regional Agency;Local/Regional;;VA;Both;;Commuting Trips;;;Website;Automated Matching: Pre-Planned Trips and Notice Board;Origin/Destination;UrbanTrans Consultants works with City LocalMotion to provide Employer Services;;;Ridematching done by Commuter Connections advertises for NuRide advertises for 5 vanpool agencies in the area;Bus/Rail Bike/Walk trip planning tools are also available on the site;HOV lane locations listed
MassRIDES Ridesharing Database;;”leeroy.wagner@eot.state.ma.us“;1-888-426-6688;;”Website“;”Summary Sheet“;State Agency;State;;MA;Both;15 000 registered users;Commuting Trips;;;Website;Automated Matching: Pre-Planned Trips;Along the Route;Works with various employers around the state;;Prize drawings;;Link to Zipcar;
MetroPool;1 Landmark Square 8th Floor Stamford CT 06901;”info@metropool.com“;800-346-3743;Mary Chalupsky;”Website“;”Summary Sheet“;;Local/Regional;;CT NY;Both;;Commuting Trips;;;Website;Automated Matching: Pre-Planned Trips;;MetroPool provides a variety of management services to employers and works with around 300 organizations;;;Links to NuRide CTRides EasyStreet nyRides Rideworks;Links to Connecticut Rail Commuter Council and all area transit;Metropool operates 5 regional offices
Metro Vanpool;;”rto@oregonmetro.gov“;503-813-7566;;”Website“;”Summary Sheet“;Local/Regional Agency;Local/Regional;Portland;OR;Vanpools;28 routes listed;Commuting Trips;;Monthly Fee;Website;Notice Board;;;Vans leased from a third party;Emergency Ride Home qualified routes get 50% subsidy on monthly lease;Advertised by CarpoolmatchNW;;Vanpools can be started by commuters or their employers
Mid-America Regional Council RideShare Program;600 Broadway Suite 200 Kansas City MO 64105;;816-842-RIDE;;”Website“;”Summary Sheet“;Local/Regional Agency;Local/Regional;Kansas City;MO;Carpools;;Commuting Trips;;;Website;Notice Board;;Working with 36 Employers providing Commuter Tracker Calendar Regional employer-based commuter challenge;;Preferred parking subsidized bus passes cash and gift certificate rewards extra time off;Powered by GreenRide Link to AdVANtage Vanpool Program;;
Mid-Missouri RideShare Program;PO Box 176 Jefferson City MO 65102;;573-522-RIDE;;”Website“;”Summary Sheet“;State Agency;Local/Regional;Jefferson City Columbia;MO;Carpools;;Commuting Trips;;;Mail / E-Mail;Automated Matching: Pre-Planned Trips;Origin/Destination;;;;Links to all other area rideshare providers;;
My RideSmart ;40 Courtland St NE Atlanta GA 30303;”RideSmart@AtlantaRegional.com“;1-877-433-3463;;”Website“;”Summary Sheet“;Local/Regional Agency;Local/Regional;Atlanta;GA;Both;;Commuting Trips;;Monthly Fee (Vanpools);Mail / E-Mail;Automated Matching: Pre-Planned Trips;Origin/Destination;Employer Service Organizations (ESO);Vans leased from a third party;Guaranteed Ride Home Gift Card drawings;;Links to area transit and a Regional Transit System map available for download;
New Hampshire Rideshare;7 Hazen Drive Concord NH 03301;;603-271-6767;;”Website“;”Summary Sheet“;State Agency;State;;NH;Both;;Commuting Trips;;;Mail / E-Mail;Automated Matching: Pre-Planned Trips;;;;;;Links to area transit;Run by NH DOT Park and Ride map provided
New Jersey Ridesharing;PO Box 600 Trenton NJ 08625;;;;”Website“;”Summary Sheet“;State Agency;State;;NJ;Both;;Commuting Trips;;Monthly Fee (Vanpools);Mail / E-Mail;Automated Matching: Pre-Planned Trips;;;Vans can be leased from third party;Carpooling Makes Sense – receive gas cards for carpool log;;;Run by NJ DOT Park and Ride map provided
NuRide;35 Pratt St Suite 108 Essex CT 06426;”http://www.nuride.com/contact“;1-866-NURIDE-1;Rick Steele;”Website“;”Summary Sheet“;Private;Local/Regional;Minneapolis/St. Paul New York City Hampton Roads San Antonio and Houston Washington DC;MN NY CT VA TX Washington DC;Carpools;36 457 Registered users 1 582 923 shared rides;All Trips;Other – Sponsors and government contracts;;Website;Automated Matching: Pre-Planned Trips;Origin/Destination;Can only use service with a verified organization e-mail address;;Reward points earned for each trip which can be redeemed for prizes;;;
Ohio RideShare;;;1-800-825-RIDE;;”Website“;”Summary Sheet“;Local/Regional Agency;Local/Regional;;OH;Carpools;;Commuting Trips;;;Website;Automated Matching: Pre-Planned Trips;Along the Route;;;;Powered by GreenRide;Link to Ohio Bike Buddies;Run by Akron Metropolitan Area Transportation Study Eastgate Regional Council of Governments and Northeast Ohio Areawide Coordinating Agency (all MPOs)
Ozarks Commute;;;831-RIDE;;”Website“;”Summary Sheet“;Local/Regional Agency;Local/Regional;;MO;Both;;Commuting Trips;;;Website;Automated Matching: Pre-Planned Trips;Along the Route;Can search for matches based on your employer;;;System is powered by RideShark;;Publicly funded
Pace RideShare;550 W Algonquin Rd Arlington Heights IL 60005;”passenger.services@pacebus.com“;847-364-PACE;;”Website“;”Summary Sheet“;Local/Regional Agency;Local/Regional;;IL;Both;;Commuting Trips;;Monthly Fee (Vanpools);Website;Automated Matching: Pre-Planned Trips;Along the Route;Employers can establish a PaceRideShare Employee Administrator who has access to a list of participating employees can create reports of travel modes trip and pollution reductions fuel and cost savings;Owns vans;For Vanpooler – Emergency Ride Home bus passes if using the bus to get to vanpool;;Run by Pace Bus Service;
Palouse Rideshare;PO Box 8596 Moscow ID 83843;”info@palouserideshare.org“;208-882-1444;;”Website“;”Summary Sheet“;Local/Regional Agency;Local/Regional;Palouse;ID;Carpools;;Commuting Trips;;;Website;Automated Matching: Pre-Planned Trips;Origin/Destination;;;;Works closely with PCEI Vanpool Network;;System is still in testing stage
Palouse – Clearwater Environmental Institute Vanpool Network;PO Box 8596 Moscow ID 83843;”info@pcei.org“;208-882-1444;;”Website“;”Summary Sheet“;Non-Profit;Local/Regional;Moscow Lewiston Orofino;ID;Vanpools;;Commuting Trips;;Monthly Fee;Mail / E-Mail;Notice Board;;;Owns vans;;Works with Palouse Rideshare;Links to fixed bus routes in the area;80% of van costs provided under CMAQ in 1994 other 20% came from local supporters
PickUp Pal;Second Floor International Trading Center Warrens St. Michael Barbados West Indies;”john@pickuppal.com“;;John Stewart;”Website“;”Summary Sheet“;Private;International;;;Carpools;;All Trips;Advertising;;Website;Automated Matching: Pre-Planned Trips;;;;;;Links to bus and rail services;Facebook application also available costs of ride are paid between rider and driver in cash users can provide feedback on their travel partners
Piggyback;France;”info@piggybackmobile.com“;;Sebastien Petit;”Website“;”Summary Sheet“;Private;International;;;Carpools;Not yet Available for Download;All Trips;;;Google Android Mobile Phone;;;;;;;;
Pooln Carpool Network;;”support@pooln.com“;;;”Website“;”Summary Sheet“;;National;;;Carpools;;Commuting Trips;;;Website;Automated Matching: Pre-Planned Trips;Origin/Destination;;;;;;Matching is done based on origin and destination zip code
Ride4All;;”Patrick@ride4all.com“;;Patrick Kelly and Tri Tran;”Website“;”Summary Sheet“;Private;National;;;Carpools;;All Trips;;;Website;Automated Matching: Pre-Planned Trips;Origin/Destination;;;;;;
Ride Amigos;;”customerservice@rideamigos.com“;;;”Website“;”Summary Sheet“;Private;Local/Regional;New York City;NY;Carpools;;All Trips;;;Website;Automated Matching: Pre-Planned Trips;Origin/Destination;Employers can create their own private ridesharing system for their employees currently RideAmigos is working with at least 12 employers;;Rewards card to receive discounts at local participating vendors;;;
Ride Arrangers;1290 Broadway Suite 700 Denver CO 80203;”info@drcog.org“;303-458-POOL;;”Website“;”Summary Sheet“;Local/Regional Agency;Local/Regional;Denver;CO;Both;;Commuting Trips;;Monthly Fee (Vanpools);Mail / E-Mail;Automated Matching: Pre-Planned Trips;;Provides complimentary assistance to employers to provide free carpooling service to employees;Owns vans;Guaranteed Ride Home for vanpoolers;;;
RideFinders;1 Transit Way PO Box 7500 Granite City IL 62040;”ridefinders@mct.org“;618-874-7433;;”Website“;”Summary Sheet“;Local/Regional Agency;Local/Regional;St. Louis;MO;Both;;Commuting Trips;;Monthly Fee (Vanpools);Website;Automated Matching: Pre-Planned Trips;Origin/Destination;Works with over 1 400 Employers;Owns vans;Incentives available when employer is registered with RideFinders – Guaranteed Ride Home;;;Operates with grant funding from USDOT and FHWA Park and Ride Map provided
RideLinks;1 S Fair Oaks Ave Suite 302 Pasadena CA 91105;”info@ridelinks.com“;626-440-9933;;”Website“;”Summary Sheet“;Private;National;;;Carpools;;Commuting Trips;Other – fee from employers;;Website;Automated Matching: Pre-Planned Trips;Origin/Destination;Employers can create their own private ridesharing system for their employees and employees of neighboring businesses;;;;;Ridematching in just one of many air quality services that RideLinks provides
Ridematch.info;;;1-800-COMMUTE;;”Website“;”Summary Sheet“;Local/Regional Agency;Local/Regional;;CA;Both;;Commuting Trips;;;Website;Automated Matching: Pre-Planned Trips and Notice Board;Origin/Destination;Offers training to employers employers can offer incentives at no additional cost Employee surveys provided;;Rideshare week – incentives/prizes;Ridematching service for commutersmart.info;;
RidePro;;”info@trapezegroup.com“;480-627-8400;;”Website“;”Summary Sheet“;Private;National;;;Both;;Commuting Trips;Other – fee from employers;;Website;Automated Matching: Pre-Planned Trips;Origin/Destination;The Trapeze Group (creator or RidePro) offers its software strictly to employers and organizations not individual commuters. Employers can manage the software on their own system or run it through a Trapeze-hosted server;;;;RidePro has to capability to provide trip planners which include public transit options for the given area;
Ride Search;1352 Riley Carrollton TX 75007;”brian@ridesearch.com“;1-800-875-7291;Brian Bass;”Website“;”Summary Sheet“;Private;National;;;Carpools;;All Trips;Advertising;;Website;Automated Matching: Pre-Planned Trips and Notice Board;Origin/Destination;RideSearch sells t-shirts business cards and reserved parking signs to promote carpooling;;;;;Notice board for non-work trips and automatic matching for work trips
The RideShare Company;100 Corporate Drive Suite 120 Windsor CT 06095;”nfitzgerald@rideshare.com“;800-842-2150;Nancy Fitzgerald;”Website“;”Summary Sheet“;Non-Profit;Local/Regional;;CT NY MA RI;Both;3000 riders/day;Commuting Trips;;;Mail / E-Mail;Automated Matching: Pre-Planned Trips;;Transportation Fairs Commuter Tax Benefit Program;;;Parent Company of EasyStreet Vanpool link to NuRide MetroPool Ctrides Rideworks ;Links to area transit;Aimed more towards employers than individual commuters
RideShare Delaware;919 N. Market St Suite 411 Wilmington DE 19801;;1-888-RIDE-MATCH;;”Website“;”Summary Sheet“;State Agency and Private Organization;;;DE;Both;;Commuting Trips;;Monthly Fee (Vanpools);Mail / E-Mail;Automated Matching: Pre-Planned Trips;Origin/Destination;Employee Surveys Marketing and Outreach Work site events Density Maps Relocation assistance;Vans leased from a third party;Emergency Ride Home Preferred Parking (employer specific);;Links to regional transit agencies;
Rideshare Online;;”rideshare@rideshareonline.com“;1-888-814-1300 1-208-345-POOL;Cathy Blumenthal;”Website“;”Summary Sheet“;Local/Regional Agency;Local/Regional;;WA ID;Both;~15 000 registered users;All Trips;;Monthly Fee (Vanpools);Website;Automated Matching: Pre-Planned Trips;;Many area employers use the services;Vans are owned by individual transit agencies;Contact local county for incentives;Run in cooperation with Washington and Idaho vanpool providers;Run by King County Metro (Transit Authority) in a partnership with 16 transit agencies;List of park and ride lots provided
Rideshare.us;;;;;”Website“;”Summary Sheet“;;International;;;Carpools;;All Trips;;;Website;Notice Board;;;;;;;US and Canada
RideShark;2031 Merivale Road Ottawa ON Canada K2G 1G7;”info@rideshark.com“;613-226-9845;Sharon Lewinson P.Eng. President;”Website“;;Private;International;Many e.g. Phoenix London Ottawa etc.;Many e.g. Quebec;Both;;All trips;Other – fee from organizations;;Website;Automated Matching: Pre-Planned Trips;Along the Route;Customized services for corporate users campuses etc.;;Prize draws loyalty points;;511 travel information & transit information;
RideSpring;849 Almar Ave Suite C 205 Santa Cruz CA 95060;”contact@ridespring.com“;831-278-0312;;”Website“;”Summary Sheet“;Private;National;;;Carpools;;Commuting Trips;Other – fee from employers;;Website;Automated Matching: Pre-Planned Trips;;Employers can create their own private ridesharing system for their employees;;Software has a built-in incentive program and RideSpring provides monthly prizes;;;
Ridester;8181 Fannin St Suite 1137 Houston TX 77054;;1-800-499-3745;Jake Boshernitzan;”Website“;”Summary Sheet“;Private;National;;;Carpools;;Inter-City Trips;Commission;Cost per Trip;Website;Automated Matching: Pre-Planned Trips;Along the Route;;;;;;$2 ticket fee + 9.5% processing fee on drivers asking price all posted trips must be longer than 20 miles
Rideworks;195 Church St New Haven CT 06510;”info@rideworks.com“;1-800-ALL-RIDE;;”Website“;”Summary Sheet“;Non-Profit;;;CT;Both;;Commuting Trips;;;Mail / E-Mail;Automated Matching: Pre-Planned Trips;Origin/Destination;Relocation services Employee Transportation Coordinator training On-site events and presentations Telecommuting consulting Marketing materials Construction announcements Transportation survey assistance Commuter Information Centers;Vans leased from EasyStreet Vanpool;Guaranteed Ride Home;Link to NuRide provided;Links to area transit;
San Luis Obispo Regional Rideshare;1150 Osos St Suite 202 San Luis Obispo CA 93401;”mmarshall@rideshare.org“;805-541-2277;Morgen Marshall;”Website“;”Summary Sheet“;Local/Regional Agency;Local/Regional;San Luis Obispo County;CA;Both;;All Trips;;Monthly Fee (Vanpools);Mail / E-Mail;Automated Matching: Pre-Planned Trips;;Transportation Choices Program;Owns 24 vans;Lucky Bucks Program – Earn bucks and cash them in for prizes Monthly drawings Guaranteed Ride Home;;Google Transit Trip Planner is embedded in the website;
Share-a-Ride;190 N. Independence Mall West 8th Floor Philadelphia PA 19106;”sharearide@dvrpc.org“;215-592-1800;;”Website“;”Summary Sheet“;Local/Regional Agency;Local/Regional;;PA;Both;;Commuting Trips;;;Mail / E-Mail;Automated Matching: Pre-Planned Trips;Origin/Destination;Mobility Alternatives Program;Vans leased from a third party;Emergency Ride Home;;Information about transit incentives (TransitChek);
Share The Ride North Carolina;;;;;”Website“;”Summary Sheet“;Local/Regional Agency;Local/Regional;;NC;Both;;Commuting Trips;;Monthly Fee (Vanpools);Mail / E-Mail;Automated Matching: Pre-Planned Trips;Origin/Destination;Must be affiliated with a registered employer to use the service;;Emergency Ride Home when provided by local agency;;Link to NCDOT Public Transit Division and Other are transit and vanpool programs;
The Carpool;PO Box 6 Kelvin Grove 4059 Brisbane Australia;”info@thecarpool.com.au“;;;”Website“;”Summary Sheet“;Private;International;;;Carpools;;All Trips;Other – fee from organizations;;Website;Notice Board;;Employers can create and manage their own private ridesharing internet site – currently there is only one employer site listed on thecarpool.com;;;;;Focused in Australia New Zealand and Singapore
Trip Convergence Ltd Flexible Car Pooling;32 Green Lane East Remuera Auckland 1050 New Zealand;”paulminett@tripconvergence.co.nz“;+64 9 524 9850 +64 21 289 8444 206-631-9702;Paul Minett;”Website“;”Summary Sheet“;Private;International;;;Both;Seeking trial locations;Commuting Trips;Other – awards grants public sources;Cost per Trip;N/A;None – Casual Carpool;None- Casual Carpool;Trip Convergence is directed towards individual users though large employment destinations with single or multiple employers could participate in establishing the system to reduce traffic to their location. ;;It is expected that incentives and prize draws will be offered both to get initial sign-up and on an ongoing basis.;;;
Utah Transit Authority Rideshare;;”wkarsch@rideuta.com“;;Wendy Karsch;”Website“;”Summary Sheet“;State Agency;State;;UT;Both;;Commuting Trips;;;Website;Automated Matching: Pre-Planned Trips;Along the Route;Employers can manage transportation needs through a web-based interface;;Commuter Challenge Incentive Program;;Run by Utah Transit Authority;
Valley Rides;;”mgarza@fresnocog.org“;559-278-2277 559-233-4148;Frederick Martinez Melissa Garza;”Website“;”Summary Sheet“;Local/Regional Agency;;Fresno;CA;Both;;Commuting Trips;;Monthly Fee (Vanpools);Website;Automated Matching: Pre-Planned Trips;Origin/Destination;;Leases Vans;;;Links and numbers for all area transit providers;Partnership between California State University Fresno and Council of Fresno County Governments
Vanpool Hawaii;711 Kapiolani Blvd Suite 985 Honolulu HI 96813;”jennie.farley@vpsiinc.com“;808-VAN-RIDE;Jennie Farley;”Website“;”Summary Sheet“;Private;State;;HI;Vanpools;;Commuting Trips;;Monthly Fee;Website;Notice Board;;Cool Pool – offers companies tax-free benefits conducts employee surveys;Owns vans;;;;Operates under VPSI nations largest vanpool provider
ZimRide;514 Bryant St Suite 119 Palo Alto CA 94301;”support@zimride.com“;1-866-422-7609;Logan Green;”Website“;”Summary Sheet“;Private;International;;;Carpools;300 00 users in the past year;All Trips;Other – fee from organizations;;Website;Automated Matching: Pre-Planned Trips;Along the Route;Provides customized site for organizations and handles all technical operations;;;;;Facebook application also available

Other Rideshare Sources

Posted by admin on February 23rd, 2009

  • OpenTrip – the beginnings of an open protocol data feed for sharing trip data among carpooling services and transit agencies.

  • WSDOT RideshareOnline Replacement RFP – I am attempting to track down on online version

  • Ridesharing Advice for Cities, Others – This blog posting on the New America Foundation website lists a number of the “structural issues” that ridesharing frequently runs into

Academic / Institutional Research

Posted by admin on February 23rd, 2009

Below is a partial list of research papers and resources ordered by published date. We will be adding additional references and some summaries over the coming weeks

Selected MIT Contributions on Ridesharing

Posted by admin on February 23rd, 2009

Slugging / Informal Ridesharing

Posted by admin on February 23rd, 2009

Technology-driven Rideshare Trials

Posted by admin on February 23rd, 2009

Rather than re-create the wheel, we direct you to various resources that have examined technology-driven rideshare trials:

Visions for Ridesharing

Posted by admin on February 23rd, 2009

Ridesharing in the National Media

Posted by admin on February 23rd, 2009

Substantial Sources of “Real-Time” Rideshare Information

Posted by admin on February 23rd, 2009

Defining Ridesharing

Posted by admin on February 22nd, 2009

One of the major challenges in establishing a consistent mental image of ridesharing is the lack of a widespread, common definition of the phenomenon. Many existing definitions attempt to define ridesharing on the basis of passenger trip purpose, frequency of trip, commonality of origin & destination, and profit motive. A common point of confusion in defining shared vehicle transportation is how to distinguish between ridesharing, public transit and taxi services.

The distinction between ridesharing and public transit is not always clear. An argument could be made that the major differences between the two are the capacity of the vehicle, and the participant that determines whether a trip is undertaken (driver or passenger). The vehicle capacity distinction should be obvious; transit frequently (but not always) operates larger vehicles such as trains and buses whereas ridesharing often occurs in smaller vehicles such as cars and passenger vans. While transit’s primary purpose is to transport multiple passengers to a destination, ridesharing differs in that it generally occurs when the driver is planning on undertaking a trip and seeks out a passenger who is willing to share the ride. In other words, transit trips operate with an implied understanding that service is based on passenger demand and if sufficient communal demand does not exist (such as on weekends) the driver will not undertake the trip (service will be reduced). Ridesharing, on the other hand, is better described as a trip that the driver intends on taking whether or not they can find an appropriate passenger to share the ride with.

The “vehicle capacity” and “trip determined by driver or passenger” characteristics alone are not entirely satisfying. If one considers taxi trips, they take place in small vehicles where the passenger dictates the purpose of the trip. Essentially, taxi trips are neither a form of transit or ridesharing according to the distinction laid out in the previous paragraph. A further refinement is the absence of a profit-seeking motive on the part of the driver in rideshare arrangements. Whereas taxi drivers are profit seeking in their carriage of passengers, rideshare drivers in most cases seek only to share the costs of transport. In fact, in some jurisdictions such as Colorado, government legislation mandates that financial transactions only reflect the sharing of trip costs.

The three characteristics of ridesharing (smaller vehicle capacities, the trip is determined by the driver’s needs and the lack of profit motive) allows for the categorization of most forms of shared vehicle transportation. The figure below presents a categorization of shared vehicle transportation where driver/passenger trip determination is on the horizontal axis, profit motive is on the vertical axis and the size of the circles represents the relative capacity of the vehicles used.

Based on the shared transport characteristics described above, we have proposed a definition of ridesharing as follows:
“the transportation of two or more individuals in a motor vehicle with a capacity not exceeding 15 passengers, when such transportation is incidental to the principal purpose of the driver, which is to reach a destination, and when such transportation does not seek to transport persons for profit.”
This definition incorporates the three characteristics described earlier in this chapter. Further, it addresses the issue of “unsustainable ridesharing”, whereby an initial rideshare journey results in an SOV return journey because the trip is undertaken to meet the needs of the passenger. “Unsustainable ridesharing” is not uncommon in school trips, where parents will drive their child to school but will return home alone. Since the definition states that the driver’s principal purpose determines the trip being undertaken, multi-occupant trips catering to the passenger’s trip purpose should not count as ridesharing according to a strict interpretation of this definition.

This definition does create some important measurement limitations. The inclusion of driver trip purpose in the definition makes the identification of rideshare trips much more difficult, and certainly more onerous than simply counting vehicles with at least two occupants. Yet, the inclusion of driver trip purpose is a very important addition to the definition of ridesharing, particularly from a policy standpoint. Ridesharing is often described as a sustainable alternative to traveling alone and is encouraged by different levels of government. Clearly the sustainability of this mode rests on the ability to combine two unique trips that would have otherwise occurred separately. When travel demand leads to the creation of a new vehicle-based trip, part of which is an SOV trip, it undermines the message that ridesharing is a sustainable mode. Ideally, the measurement of rideshare participation should differentiate between multi-occupant trips undertaken based on driver vs. passenger trip purpose, and only assign credit to those where the driver’s trip purpose dictated travel. To operationalize this definition, more precise travel diaries and surveys would need to be administered specifically asking participants what the purpose of their trip was, and seeking more detailed information on trip-chaining tendencies.

Selective History of Ridesharing

Posted by admin on February 22nd, 2009

It is interesting to note that there is not a substantial amount of information written on the history of ridesharing. Given the difficulty in measuring ridesharing, and distinguishing it from private automobile travel, this finding is not particularly surprising.

Jitney Craze: 1914-1918
The first historical incidence of ridesharing success was the tremendously popular yet short lived “Jitney Craze” beginning in 1914. In 1908, the Ford Motor Co. began offering the Model T, the first mass-produced automobile that was affordable to the average “successful” person. The vehicle’s popularity soared; in 1908 only 5,896 Model T’s were sold but by 1916 sales had soared to 377,036 nationwide (Hodges, 2006). With the increasing penetration of the relatively affordable automobile, streetcars faced their first real competition in the urban transport market. In the summer of 1914, the US economy fell into recession with the outbreak of WWI and some entrepreneurial vehicle owners in Los Angeles began to pickup streetcar passengers in exchange for a ‘jitney’ (the five cent streetcar fare). The jitney idea spread incredibly rapidly; by December 1914 (merely 6 months after the idea was believed to have been conceived) Los Angeles had issued 1,520 chauffeur licenses for jitney operation (Eckert & Hilton, 1972). In San Francisco, jitneys first appeared in 1914 and were first used to transport workers and attendees to the 1914-1915 Panama-Pacific International Exposition. By 1915, over 1,400 jitneys were operating in San Francisco (Cervero, 1997). With the first jitney’s beginning service in Portland, ME in March 1915, the jitney craze had spread from west to east in nine months (Eckert & Hilton, 1972).

Many of the original jitneys operated on well-known streetcar lines and effectively survived by siphoning off streetcar passengers. From the passenger’s perspective, the jitneys offered service improvements over the streetcar. Jitney’s often operated at speeds 1.5 to 2 times faster than streetcars (Eckert & Hilton, 1972) and could occasionally be convinced to deviate from main routes for drop-offs closer to passenger destinations. For passengers, the ability to choose between two service offerings for the same price was also an attractive service feature. While the reliability of jitney service was sometimes questionable (many only ran during peak periods, few ran during bad weather), passengers had a second option in the form of the streetcar. Travel time savings, route flexibility and transport mode choice were the major value propositions for passengers.

Jitney use was not without tradeoffs. Jitney drivers were known to drive aggressively and accidents were frequent. With passengers standing on the back of vehicles and on the running boards, serious injuries did occur. The transport of female passengers raised concerns in some social circles (Hodges, 2006).

An underlying question that remains a topic of debate is whether jitneys constituted a form of ridesharing or unregulated taxi service. To properly answer this question, the impetus for offering rides should be considered. Given the downturn in the economy, stories of unemployed persons purchasing a vehicle and becoming a jitney operator have been cited in the literature (Eckert & Hilton, 1972, Hodges, 2006). In these cases, jitney service could best be characterized as unregulated taxi service, as drivers were operating the vehicle for the express purpose of providing service to others. In other cases, jitney service seemed to be a method of offsetting the costs of private vehicle ownership for trips that were already going to take place. In a survey in Houston, TX on February 2, 1915, of the 714 active jitneys that day, 442 (62%) made only one or two round-trips, suggesting they might be operating as a jitney during their commute to and from work (Hodges, 2006). In these cases, the primary purpose of the trip was likely commuting; providing service to others was secondary. Any additional revenue generated simply offset the cost of vehicle ownership. In these cases, the generation of revenue was not the main purpose for operating the vehicle, so it could be argued that the service was a form of ridesharing.

The downfall of the jitneys was nearly as rapid as their rise. By early 1915, concerns over safety and liability were being reported in the popular press (New York Times, 1915). Streetcar interests and local governments were eager to stop jitney operations to limit losses in revenue. Streetcar operators were losing paying customers to jitneys, and local governments often taxed streetcar operators a percentage of revenue that they earned, so they were losing tax income as well (Eckert & Hilton, 1972). Many local governments implemented license requirements for jitneys, but the regulation with the largest impact was the imposition of liability bonds. Before operating, jitney drivers were forced to post $1,000 to $10,000 in liability insurance. The licensing and liability regulations added annual costs of approximately $150 to $300, or 25-50% of annual earnings for full-time jitney operators. By July 1915, twenty-seven localities had implemented liability regulations (Eckert & Hilton, 1972). It was estimated that of the 62,000 jitneys in operation in 1915, only 39,000 were still in operation by January 1916 and fewer than 6,000 by October 1918 (Eckert & Hilton, 1972).

There are several important reflections to be drawn from the “Jitney Craze” period. First, the original impetus for picking up passengers appears to have been due to the downturn in the economy. For those that already owned a vehicle, the offering of a ride was presumably to offset operating and ownership costs. For those that began offering jitney services during the period, many had been unemployed and saw operating a jitney as an employment opportunity. In either case, personal finance issues appear to have been a factor. Second, liability and safety were two of the major concerns with jitney service. These same issues remain major concerns with ridesharing today. Third, jitney service provision did not appear to be driven in any major way by resource constraints or environmental benefits, it was largely due to gaps in service quality and economic factors.

World War II: 1941-1945
The second major period of rideshare participation, and the period most likely to be identified as the first instance of traditional carpooling, was during World War II (WWII). In a reversal from the jitney era, government encouraged ridesharing heavily during WWII as a method of conserving resources for the war effort. This period of rideshare promotion was exceptionally unique in that it entailed an extensive and cooperative effort between the federal government and American oil companies.

European involvement in WWII began in 1939 but US involvement did not get underway until late-1941 and early-1942. Nevertheless, the federal government had begun making preparations for war much earlier. In May 1941, President Roosevelt established the Office of the Petroleum Coordinator (OPC) (US PAW, 1946). OPC was created to coordinate and centralize all government activities related to petroleum use. The Office was unique in that it relied heavily on industry committees to make recommendations to government; government initiated very few regulations (US PAW, 1946). This structure was chosen specifically because it encouraged all oil industry participants to cooperate amongst themselves, and it was felt that a more cooperative relationship with industry would lead to a greater overall level of voluntary effort.

By July 1941, one of OPC’s industry committees organized the first known petroleum conservation effort in the US. The campaign was launched on the East Coast with a $250,000 advertisement budget funded entirely by industry asking the motoring public to use 30% less gasoline (US PAW, 1946). Recommended actions included lowering drive speeds, proper care of tires and the sharing of rides. By the industry’s own admission, the effort was not terribly successful. A lack of public appreciation of the need to conserve fuel was cited as the leading challenge to be overcome; “this first drive to emphasize to the American people the necessity of gasoline conservation served one important purpose: it showed industry itself the magnitude of the task, and the growing need for a long-range, sustained program of public education” (US PAW, 1946).

In November 1941, industry created their official council that would interact with the federal government. The Petroleum Industry War Council (PIWC, originally named the Petroleum Industry Council for National Defense), a group that consisted entirely of petroleum industry representatives, was the entity that would ultimately design and fund all petroleum conservation activities during WWII (US PAW, 1946). In an odd twist of irony, PIWC held their first committee meeting on Dec. 8, 1941, one day after the attack on Pearl Harbor and the exact day that President Roosevelt signed the declaration of war against Japan. By February 1942, PIWC had established their Subcommittee on Products Conservation (under the Marketing Committee) and had completed the design of their nationwide conservation program by month’s end (US PAW, 1946). After a year and a half of effort, the Subcommittee was discharged in September 1943 and replaced by the higher-level Products Conservation Committee, suggesting the growing importance of oil conservation. This structure remained until the end of WWII. The Products Conservation committee’s programs had three main goals; (a) to provide the public with facts so that everyone might better understand the need for rationing, (b) to obtain better compliance with rationing programs, and (c) to bring about greater conservation of gasoline through car sharing [carpooling] and other measures (US PAW, 1946).

The Products Conservation committee was made up largely of advertising specialists. The bulk of the rideshare initiative (and all conservation initiatives during the War) focused on catchy slogans, posters and newspaper advertisements. While the PIWC spent considerable time developing some of the most recognized posters during WWII, they themselves did not publish them. OPC worked collaboratively with various government agencies including the Office of War Transportation, the Office of Price Administration and the Office of War Administration to distribute the ads that they created (US PAW, 1946). All advertisements were released to the public through a government agency. It is once again worth noting that the petroleum industry volunteered their time and resources to this effort with little financial support from government. At the end of the War, it was estimated that the Products Conservation committees had expended $8M. in private funding to support conservation efforts alone (US PAW, 1946).

bkgrd_01_poster

While there is plenty of evidence of rideshare promotion during WWII, no information could be found on how successful the initiatives actually were. Some statistics exist on the number of newspaper advertisements placed and the estimated readership reached; however, little appears to be known about the actual level of ridesharing that took place during WWII. As discussed in the introduction to this section, part of the reason may be the lack of a financial transaction when sharing rides. Total auto use and transit ridership can be reasonably measured using financial transaction data, but rideshare participation cannot.

As with the “Jitney Era”, there are some important reflections to be drawn from the rideshare experience during WWII. In contrast to the “Jitney Era”, the main force behind ridesharing during WWII was government-mandated resource constraints (gasoline and rubber) rather than a market response to an economic downturn or a gap in transit service quality. Further, marketers during WWII understood that by appealing to patriotism they could encourage behavior change. There appears to have been a sincere belief that those remaining in the U.S. should make an effort to support their countrymen overseas by reducing their consumption and by making a behavioral change. Third, and perhaps most importantly, was the fact that the promotion of ridesharing during WWII was a large cooperative effort between the U.S. federal government and private industry. It is clear that interests of national importance took precedence over corporate interests during this time period, however, in the absence of a national emergency or compelling long-term threat, it is not likely that this sort of public-private relationship between government and the petroleum industry could be recreated today.

The 1970’s Energy Crises
The third period of interest and participation in ridesharing was during the energy crises of the 1970’s. Interest in ridesharing picked up substantially with the Arab Oil Embargo in the fall of 1973. Throughout the fall and early winter of 1973, President Nixon’s administration realized that action would need to be taken to reduce petroleum consumption. In January 1974, Nixon signed the Emergency Highway Energy Conservation Act, which mandated maximum speed limits of 55 MPH on public highways (Woolley & Peters, [2]). The Act was also the first instance where the US federal government began providing funding for rideshare initiatives. For the first time, states were allowed to spend their highway funds on rideshare demonstration projects (Woolley & Peters, [2]). The 1978 Surface Transportation Assistance Act would eventually make funding for rideshare initiatives permanent (US EPA, 1998).

It was during this initial energy crisis that states began experimenting with High Occupancy Vehicle (HOV) lanes. The Shirley Memorial Highway in Northern Virginia had opened as a dedicated busway in the center of the highway in 1969 becoming the first highway in the nation to provide dedicated infrastructure for High Occupancy Vehicles (Kozel, 2002). Beginning in December of 1973, vehicles with four or more passengers were also allowed to use the busway. HOV lane construction proceeded slowly through the 1970’s, with interest increasing in the mid-1980’s. While the number of required occupants was eventually decreased to three, the Shirley Highway remains one of the most heavily used HOV corridors in the nation today (Kozel, 2002).

The early 1970’s marked another first for ridesharing; it was the first time that it was recommended as a tool to mitigate air quality problems (Horowitz, 1976). The 1970 Clean Air Act Amendments established the National Ambient Air Quality Standards and gave the Environmental Protection Agency (EPA) substantial authority to regulate air quality attainment (US EPA, 2008). After initially rejecting the State of California’s ‘transportation control plan’ to meet Clean Air Act requirements in the Los Angeles basin in mid-1972, the EPA issued its own draft plan in late-1972 (Bland, 1976). The initial plan was met with substantial backlash, particularly a provision that would reduce gasoline consumption during the high-smog summer months by an incredible 86% through an aggressive gasoline rationing system. After public consultations, a much more moderate final control plan was issued in 1973. One of the main provisions of the final plan was a two-phase conversion of 184 miles of freeway and arterial roadway lanes to bus/carpool lanes and the development of a regional computerized carpool matching system (Bland, 1976). Phase One was to be completed by May 1974 and Phase Two by May 1976. By the 1976 Phase Two deadline, not a single lane-mile of roadway had been converted for high occupancy vehicle traffic (the El Monte Busway was opened in 1973 and allowed HOV 3+ in 1976; however, it was designed and operating as a high occupancy vehicle facility prior to EPA’s final control plan and therefore did not count as a conversion) (Bland, 1976). In fact, the next HOV project in LA County would not be constructed until 1985 and by 1993 there was still only 58 miles of HOV lanes countywide (LA MTA, 2009).

The post-1973/74 Oil Embargo period was a time of great interest in ridesharing. With the funding of rideshare demonstration projects in 1974, academic study of ridesharing and of the results of the rideshare demonstration projects began in earnest. The post-73/74 period also saw the creation of the nation’s first metropolitan rideshare agencies (US EPA, 1998). At the outset, these organizations relied largely on marketing campaigns encouraging ridesharing, largely disseminated through roadside signs and public service messages. As research into ridesharing progressed, the importance of employer-based initiatives became better understood and many agencies began to work more closely with large employers (US EPA, 1998).

By the late-1970’s, President Carter proposed multiple initiatives to further encourage ridesharing. In 1979, he appointed the National Task Force on Ridesharing to “expand ridesharing programs through direct encouragement and assistance, and create a continuing dialogue among all parties involved in managing ridesharing programs and/or incentive programs” (Downs, 1980, Woolley & Peters, [1]). His administration also understood the negative effect of parking subsidies on rideshare participation. In 1979, his administration tried to amend the National Energy Conservation Act (NECA) to eliminate subsidized parking for federal employees. The bill faced strong opposition from federal employees and was never passed (S. 930, 1979). In 1980, a bill was even introduced which sought to create a National Office of Ridesharing. As with the NECA amendment, this bill was never passed into law (HR. 6469, 1980).

The energy crises of the 1970’s marked a number of ‘firsts’ for ridesharing. It was the first time that the federal government formally funded rideshare initiatives, it was the first time that ridesharing was prescribed as an air quality mitigation strategy and it was the beginning of formal academic research into rideshare motivations and the potential to reduce petroleum consumption. As with previous periods though, national rideshare statistics were just starting to be gathered, making it difficult to determine how influential the energy shortages and government-sponsored programs had been on participation. Much like ridesharing in the WWII-era, the federal government’s involvement was largely a response to a resource shortage, in this case exclusively petroleum.

While many held strong hopes for ridesharing at the beginning of the 1980’s, low oil prices and strong economic growth throughout the decade and into the 1990’s dashed those hopes.

News / Updates

Posted by admin on February 22nd, 2009

September 13, 2010
After this year’s rideshare workshop at the 2010 TRB Annual Meeting (“Reinventing Carpooling to Meet Transportation’s Greatest Challenges”), a follow-up workshop has been scheduled for the 2011 TRB Annual Meeting this coming January. For information on last year’s workshop, and to help create the agenda for this year’s workshop, please visit the “Emerging Ridesharing Solutions workshop” website.

August 31, 2010
The website has been substantially updated including a number of new documents in the Resources section, please take a look around.
The APA has posted the broadcast and presentation materials for the webinar titled “Dynamic Ridesharing”: Carpooling Meets the Information Age.

August 3, 2010
Quite a number of updates to pass along:
1. The Research Team has been busy writing and is happy to share the first master’s thesis (“Real-Time” Ridesharing: Exploring the Opportunities and Challenges of Designing a Technology-based Rideshare Trial for the MIT Community) to be written based on this research, and two working papers submitted to the 2011 Transportation Research Board; ‘“Real-Time” Ridesharing – The Opportunities and Challenges of Utilizing Mobile Phone Technology to Improve Rideshare Services‘ & ‘A Proposed Methodology for Estimating Rideshare Viability within an Organization, applied to the MIT Community
2. Research Team member Andrew Amey will be joining Marc Oliphant to host an American Planning Association webinar titled “Dynamic Ridesharing”: Carpooling Meets the Information Age on Thursday, August 5th at 1pm Eastern. Participation is free, please plan on attending.
3. Congratulations to Avego Shared Transport for being selected as the provider for a new flexible carpool pilot program in Seattle!
4. Congratulations to Santa Barbara County & Santa Barbara Community Environmental Council for being awarded funding through FHWA’s Value Pricing Pilot Program for the development of a dynamic ridesharing service!

March 17, 2010
Two exciting pieces of news to share today:
1. The Winter 2010 Edition of TDM Review contains a series of articles on ridesharing, many contributed by the MIT “Real-Time” Rideshare Research Team.
2. A working paper written by Research Team member Andrew Amey was awarded Second Place in the American Planning Association, Transportation Planning Division, 2010 Student Paper Competition.

December 15, 2009
Just a quick reminder about an upcoming discussion on ridesharing. A session titled “Reinventing Carpooling to Meet Transportation’s Greatest Challenges” will take place at the 2010 Transportation Research Board (TRB) Annual Meeting in Washington, DC on Sunday, January 10th. The session will take place from 1:30 – 4:30pm at the Marriott hotel. If you are planning on attending the TRB Annual Meeting, or are going to be in DC around that time, please plan on attending the session.

September 26, 2009
Congratulations to iCarpool for winning the ITS America Congestion Challenge and collecting the $50,000 USD award!

July 30, 2009
The much anticipated “Moving Cooler” report from Cambridge Systematics was released two days ago and had some interesting results on ridesharing’s potential to reduce GHG emissions and energy consumption. Their modeling suggested that ridesharing was an attractive non-pricing strategy to reduce GHG emissions and could account for 0.5 – 2.0% fuel savings nationwide, depending on the level of deployment.

July 1, 2009
One of the Real-Time Rides Workshop participants, Paul Minett, has submitted a TCRP Proposal for consideration and potential funding. The proposal is titled, “How Can Carpooling/Vanpooling Complement Transit Services, to Reduce SOV Travel?” and can be found here.

June 30, 2009
Several of Updates:
1. ITS America Congestion Challenge – The goal of the challenge is to identify the “best ideas to solve congestion, improve mobility, the environment and public safety.” Proposals can be in any stage of development (concept through revenue generating service). Registration is open until August 1, 2009 I believe. In August, the top 9 entries will be selected and the winner will be announced in September. The winning prize is $50,000 USD.

2. Atlantic Monthly Piece on Dynamic Ridesharing – Atlantic Monthly’s June 2009 edition had a small piece on dynamic ridesharing titled, “How to End Traffic in Los Angeles”.

May 10, 2009
The Workshop Summary has now been posted to the website. It can be found along with all of the other workshop information on the Real-Time Rides page.

April 14, 2009
A comprehensive version of the agenda with locations has been posted. We’ve also provided more detail on how to find Building 1 on the first day of the workshop. All of this information can be found on the Real-Time Rides Workshop page.