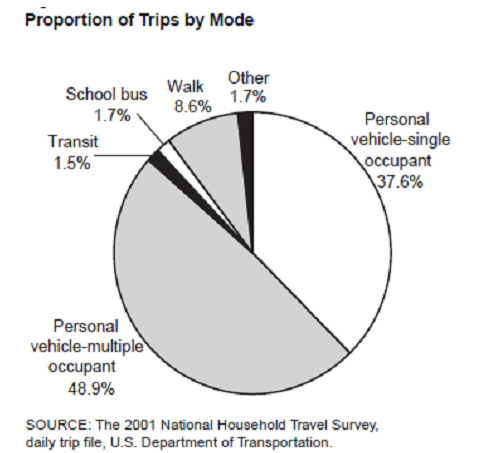
All of the statistics quoted thus far have been based on Home based Work (HBW) trips, or commute trips in other words. Looking at carpool and vehicle occupancy rates for all trips (including HBW) shows a very different story. According to the 2001 NHTS, multi-occupant vehicle trips (i.e. carpool trips) account for 48.9% of trips as compared to 12.6% of work-only trips. This is an interesting fact to consider when developing a rideshare strategy. While lower occupancy HBW trips and work-related trips only account for 16% of total trips in the US, they cause a disproportionately high percentage of the congestion experienced nationwide. Shifts from SOV to HOV for weekday commute trips are likely to have larger positive impacts on congestion than similar shifts in non-commute trips. This would seem to suggest that ridesharing initiatives should focus on commute-based trips.

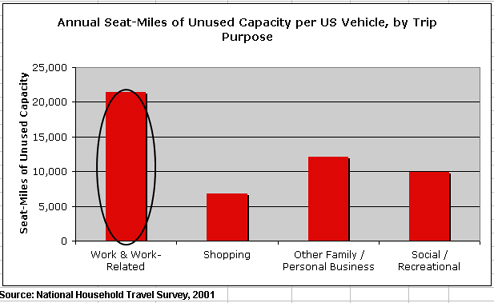
Occupancy for different trip purposes is only one aspect of capacity utilization; one must also consider differing trip lengths by trip purpose. The following chart shows total annual seat miles of unused capacity per vehicle for different trip types. So while only 16% of total trips nationwide are commute trips, they represent 33% of total seat-miles of unused vehicle capacity (and 46% of peak period seat-miles of unused vehicle capacity). This reinforces the previous belief that ridesharing initiatives should focus on commute-based trips. However, one should also consider the differing values of time that users place on different trip types. Commute trips are likely to have a higher value of time for most drivers, thereby making any inconvenience or delay in their journey incredibly onerous. If ridesharing is to be improved during the commute, convenience for drivers and passengers, and minimal delays are essential.

Posted by admin on Tuesday, February 24th, 2009 at 12:23 pm.

